5. Application Instrumentation

🚀 Aspiring DevOps & Cloud Engineer | Passionate about Automation, CI/CD, Containers, and Cloud Infrastructure ☁️ I work with Docker, Kubernetes, Jenkins, Terraform, AWS (IAM & S3), Linux, Shell Scripting, and Git to build efficient, scalable, and secure systems. Currently contributing to DevOps-driven projects at Assurex e-Consultant while continuously expanding my skills through hands-on cloud and automation projects. Sharing my learning journey, projects, and tutorials on DevOps, AWS, and cloud technologies to help others grow in their tech careers. 💡 Let’s learn, build, and innovate together!
Introduction
Prometheus is already monitoring metrics from various components of our infrastructure, including Linux servers, Windows servers, Docker containers, and the Docker engine. However, to gather metrics specific to your application, you need to add instrumentation directly in your code. This is where Prometheus client libraries become indispensable.
A Prometheus client library simplifies the process of embedding metric tracking into your application. It formats the metrics following the Prometheus standard and exposes them via a /metrics endpoint, where Prometheus can easily scrape and collect them.
Prometheus officially supports several client libraries for these popular programming languages:
Go
Java
Python
Ruby
Rust
In addition, there are unofficial third-party client libraries available for other languages, and you can even develop your own library if your language isn’t supported or to avoid extra dependencies.
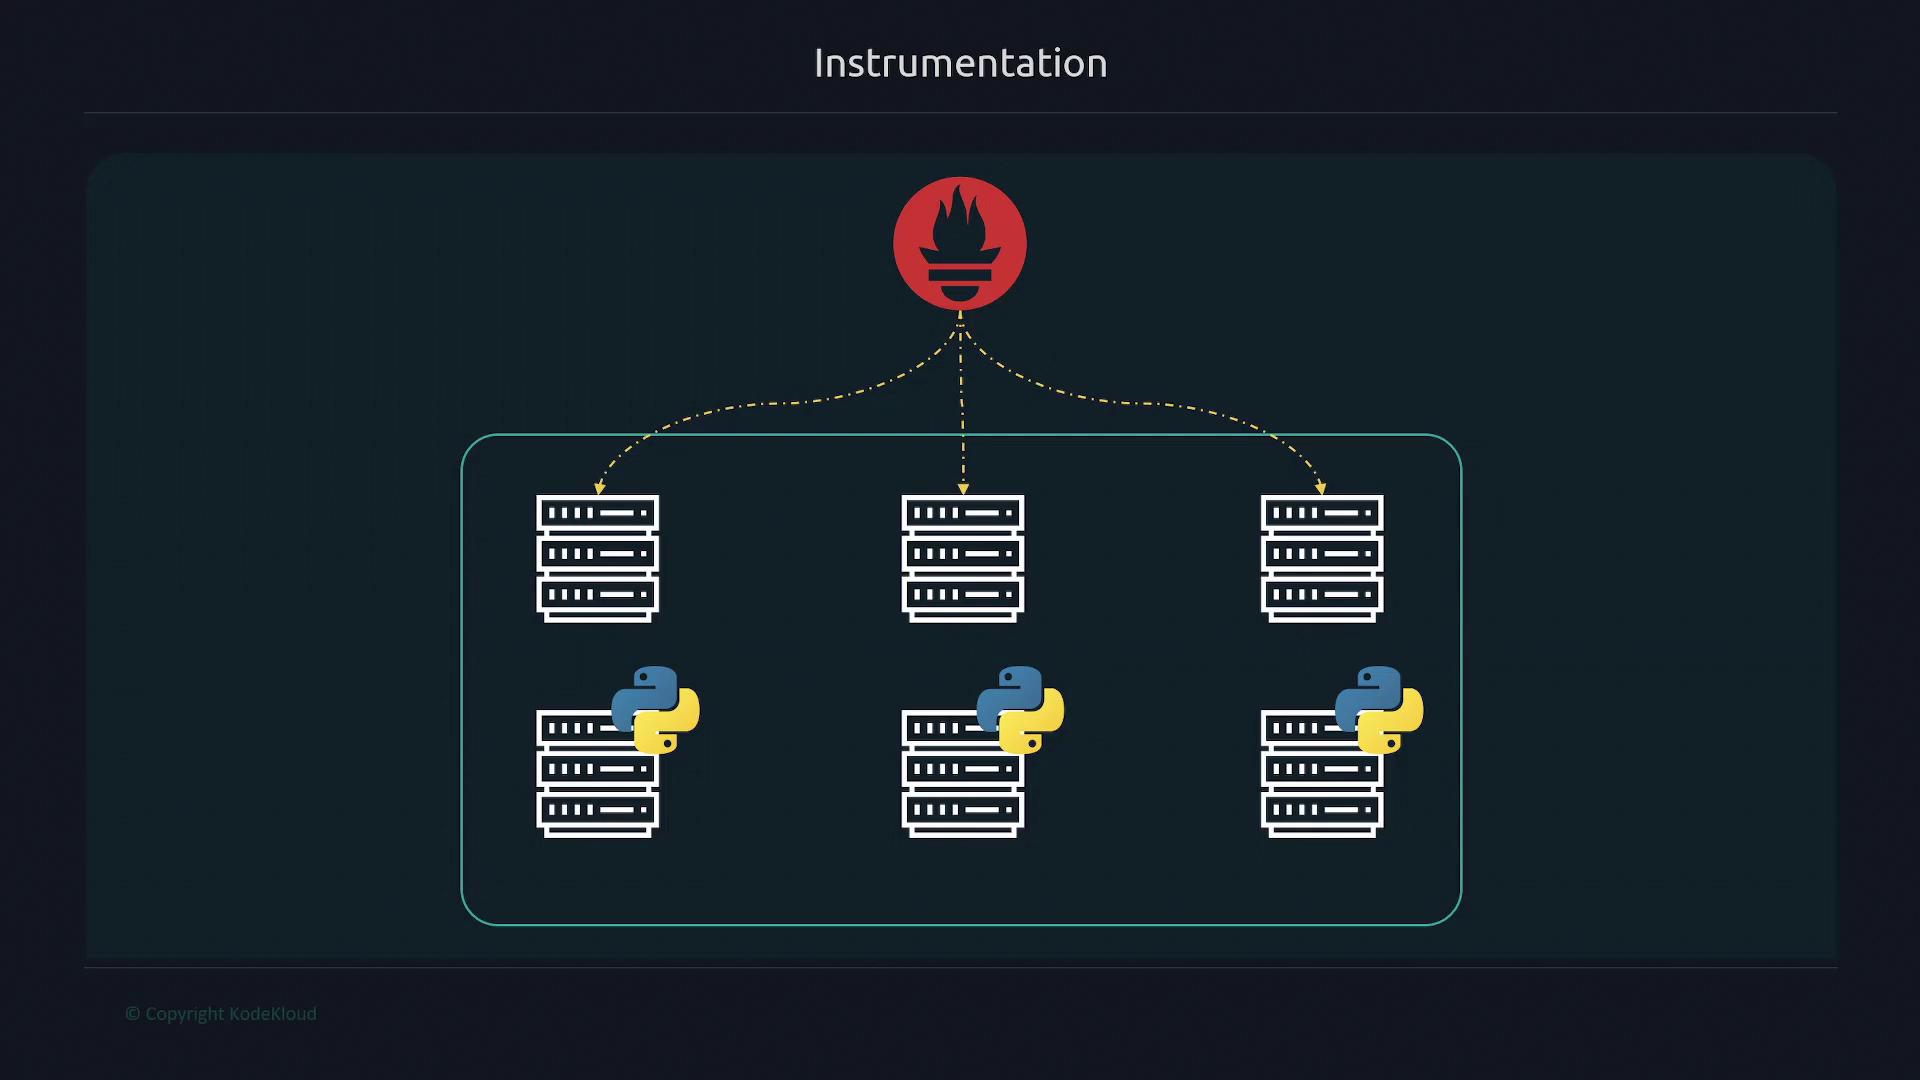
For a clear visual representation, refer to the network diagram below which shows a centralized Prometheus instance monitoring multiple servers and Docker engines:
Below is a JavaScript code snippet that demonstrates a functional approach used in one of the client libraries:
res = fms.reduce((accum, next) => next(accum), res)


const unfold = (f, seed) => {
  const res = f(seed)
  return res ? [res[0]].concat(unfold(f, res[1])) : acc
}
return g0f(seed, [])
Key Insight
Effective instrumentation in your application can provide valuable insights into performance and usage metrics, which are essential for optimizing and troubleshooting in production environments.
In this lesson, our focus is on instrumenting a Python-based application. Even if you're new to Python or programming in general, you will learn how to integrate metric collection within your application, and understand the types of metrics being tracked. These principles apply regardless of your programming language or application type.
The diagram below categorizes both official and unofficial Prometheus client libraries by language (e.g., Go, Java/Scala, Python, etc.), and also highlights the flexibility to create custom client libraries if necessary:

Our primary focus will be on instrumenting an API to collect detailed metrics, ensuring robust monitoring and performance optimization for your services.
Instrumentation basics
In this tutorial, we will demonstrate how to add instrumentation to your application by building a dummy API using Flask—a robust Python web framework for creating RESTful APIs quickly. Our primary focus is on incorporating Prometheus instrumentation rather than delving into the internals of Flask.
Overview
This guide shows you how to integrate instrumentation step-by-step into a basic Flask application. Follow along to learn about adding counters to track HTTP requests and exposing metrics via Prometheus.
Creating a Basic Flask Application
First, create a simple Flask application. In Python, you import the Flask package, initialize a Flask instance, and then create an API endpoint. For example, any GET request to the /cars endpoint will trigger the following function:
from flask import Flask
app = Flask(__name__)


@app.get("/cars")
def get_cars():
    return ["toyota", "honda", "mazda", "lexus"]


if __name__ == '__main__':
    app.run(port='5001')
This code snippet represents the foundation of our API. At this stage, the application does not include any Prometheus instrumentation.
Installing the Prometheus Client Library
Before adding instrumentation, install the Prometheus client library:
pip install prometheus_client
Once installed, you can import and use the Counter object from the Prometheus client to track your application's metrics. For instance, initialize a counter called http_requests_total to record every HTTP request:
from prometheus_client import Counter


REQUESTS = Counter('http_requests_total', 'Total number of requests')


app = Flask(__name__)


@app.get("/cars")
def get_cars():
    return ["toyota", "honda", "mazda", "lexus"]
Incrementing the Counter
To accurately track the number of requests, increment the counter each time the /cars endpoint is hit. You can use the REQUESTS.inc() method, which increases the counter by 1 for each request. Optionally, you can pass a value to inc() if you need a different increment:
from prometheus_client import Counter


REQUESTS = Counter('http_requests_total', 'Total number of requests')


app = Flask(__name__)


@app.get("/cars")
def get_cars():
    REQUESTS.inc()
    return ["toyota", "honda", "mazda", "lexus"]
Exposing Metrics via a Separate HTTP Server
Currently, while metrics are recorded, they are not exposed to Prometheus. The simplest method to expose these metrics is to start Prometheus’s built-in HTTP server on a separate port (e.g., port 8000):
from prometheus_client import Counter, start_http_server


if __name__ == '__main__':
    start_http_server(8000)
    app.run(port='5001')
With this configuration, your Flask API runs on port 5001 while Prometheus metrics are available at port 8000. You can test the metrics endpoint using:
$ curl 127.0.0.1:8000
# HELP python_gc_objects_uncollectable_total Uncollectable object found during GC
# TYPE python_gc_objects_uncollectable_total counter
python_gc_objects_uncollectable_total{generation="0"} 0.0
python_gc_objects_uncollectable_total{generation="1"} 0.0
python_gc_objects_uncollectable_total{generation="2"} 0.0
# HELP python_gc_collections_total Number of times this generation was collected
# TYPE python_gc_collections_total counter
python_gc_collections_total{generation="0"} 77.0
python_gc_collections_total{generation="1"} 7.0
python_gc_collections_total{generation="2"} 0.0
# HELP python_info Python platform information
# TYPE python_info gauge
python_info{implementation="CPython",major="3",minor="9",patchlevel="5",version="3.9.5"} 1.0
# HELP http_requests_total Total number of requests
# TYPE http_requests_total counter
http_requests_total 5.0
# HELP http_requests_created Total number of requests
# TYPE http_requests_created gauge
http_requests_created 1.6654499091926205e+09
Integrating Metrics with Flask Middleware
If you prefer to run the API and metrics on the same port, you can expose metrics via a dedicated endpoint by integrating Prometheus with Flask middleware. This method uses make_wsgi_app from the Prometheus client alongside DispatcherMiddleware from Werkzeug:
from flask import Flask
from prometheus_client import make_wsgi_app
from werkzeug.middleware.dispatcher import DispatcherMiddleware


app = Flask(__name__)


# Add Prometheus middleware to export metrics at /metrics
app.wsgi_app = DispatcherMiddleware(app.wsgi_app, {
    '/metrics': make_wsgi_app()
})
With this setup, your Flask API is still served on port 5001, and you can retrieve Prometheus metrics from the /metrics endpoint.
Extending the Application with Additional Endpoints
Next, extend the application by adding several routes that handle different HTTP methods. In this example, endpoints are added to return all cars, retrieve a specific car by ID, create a new car, update car details, and delete a car. In a real-world scenario, you should increment the REQUESTS counter for every request:
@app.get("/cars")
def get_cars():
    REQUESTS.inc()
    return ["toyota", "honda", "mazda", "lexus"]


@app.get("/cars/<int:id>")
def get_car():
    REQUESTS.inc()
    return "Single car"


@app.post("/cars")
def create_cars():
    REQUESTS.inc()
    return "Create Car"


@app.patch("/cars/<int:id>")
def update_cars():
    REQUESTS.inc()
    return "Updating Car"


@app.delete("/cars/<int:id>")
def delete_cars():
    REQUESTS.inc()
    return "Deleting Car"
At this point, your fully instrumented Flask API accurately reflects the total number of HTTP requests via the http_requests_total counter. You can access and monitor your metrics either through the standalone Prometheus HTTP server on port 8000 or directly via the /metrics endpoint if using the middleware approach.
Next Steps
For more detailed information on Prometheus instrumentation, refer to the Prometheus Client Documentation. Additionally, visit the Flask Documentation for further insights into building robust web applications.
Labels
In this article, we explain how to modify your application to record the number of HTTP requests per endpoint while still keeping track of the overall total. Initially, the application handles requests for two endpoints: /cars and /boats. Let’s start with a basic implementation that uses a global counter which increments on every call.
Basic Counter Example
The following code demonstrates a simple approach where a single counter, REQUESTS, is incremented regardless of the endpoint.
@app.get("/cars")
def get_cars():
    REQUESTS.inc()
    return ["toyota", "honda", "mazda", "lexus"]


@app.post("/cars")
def create_cars():
    REQUESTS.inc()
    return "Create Car"


@app.get("/boats")
def get_boats():
    return ["boat1", "boat2", "boat3"]


@app.post("/boats")
def create_boat():
    return "Create Boat"
While this method works to keep track of the total number of requests, it does not allow you to determine how many requests each endpoint receives. To achieve this, you could create individual counters for every endpoint.
Endpoint-Specific Counters
One approach is to instantiate separate counters for each endpoint. This method is straightforward, but it requires you to manually update queries and configurations each time a new endpoint is added.
CAR_REQUESTS = Counter('requests_cars_total',
                         'Total number of requests for /cars path')
BOATS_REQUESTS = Counter('requests_boats_total',
                           'Total number of requests for /boats path')


@app.get("/cars")
def get_cars():
    CAR_REQUESTS.inc()
    return ["toyota", "honda", "mazda", "lexus"]


@app.post("/cars")
def create_cars():
    CAR_REQUESTS.inc()
    return "Create Car"


@app.get("/boats")
def get_boats():
    BOATS_REQUESTS.inc()
    return ["boat1", "boat2", "boat3"]


@app.post("/boats")
def create_boat():
    BOATS_REQUESTS.inc()
    return "Create Boat"
Maintenance Consideration
As your application scales up, managing multiple counters for different endpoints can become cumbersome. Each new endpoint will require additional counter instances and updates in your monitoring queries.
Using Labels for Request Counters
A more scalable solution is to use labels. This approach allows you to define a single counter with the flexibility of differentiating request paths using labels. When initializing the counter, you specify a list of label names (in this example, we use path). Then, while handling a request, call the labels method with the appropriate path before incrementing the counter.
REQUESTS = Counter('http_requests_total',
                   'Total number of requests',
                   labelnames=['path'])


@app.get("/cars")
def get_cars():
    REQUESTS.labels('/cars').inc()
    return ["toyota", "honda", "mazda", "lexus"]


@app.post("/cars")
def create_cars():
    REQUESTS.labels('/cars').inc()
    return "Create Car"


@app.get("/boats")
def get_boats():
    REQUESTS.labels('/boats').inc()
    return ["boat1", "boat2", "boat3"]


@app.post("/boats")
def create_boat():
    REQUESTS.labels('/boats').inc()
    return "Create Boat"
With this setup, you can query the metrics for a specific endpoint by filtering on the path label. For example, running the query for the /cars endpoint would look like this:
$ http_requests_total{path="/cars"}
http_requests_total{path="/cars"} 5.0
Similarly, you can retrieve metrics for the /boats endpoint or aggregate totals across all paths:
$ http_requests_total{path="/boats"}
http_requests_total{path="/boats"} 2.0


$ http_requests_total
http_requests_total{path="/cars"} 5.0
http_requests_total{path="/boats"} 2.0


$ sum(http_requests_total)
{} 7.0
Extending Labels: Tracking HTTP Methods
To enhance your monitoring further, you might want to track the HTTP method (e.g., GET or POST) alongside the request path. This requires adding a second label called method during counter initialization. When handling a request, provide both the path and the method to the labels method.
REQUESTS = Counter('http_requests_total',
                   'Total number of requests',
                   labelnames=['path', 'method'])


@app.get("/cars")
def get_cars():
    REQUESTS.labels('/cars', 'get').inc()
    return ["toyota", "honda", "mazda", "lexus"]


@app.post("/cars")
def create_cars():
    REQUESTS.labels('/cars', 'post').inc()
    return "Create Car"


@app.get("/boats")
def get_boats():
    REQUESTS.labels('/boats', 'get').inc()
    return ["boat1", "boat2"]


@app.post("/boats")
def create_boat():
    REQUESTS.labels('/boats', 'post').inc()
    return "Create Boat"
From the framework's perspective (for example, in Flask), the method label corresponds to the actual HTTP method used in the request. This configuration allows you to query the metrics either by combining both labels—for instance, filtering by method="get"—or solely by the path label to obtain aggregated counts. This flexible, label-based approach enables scalable and maintainable monitoring of your application’s endpoints as it grows and evolves.
HistogramSummary
In this guide, you'll learn how to implement a histogram metric in Python to track the latency and response time for each request in a Flask application. We will demonstrate how to record latency using a histogram metric on a per-path and per-method basis, similar to recording counter metrics. This approach provides an in-depth view of your application's performance.
Setting Up the Histogram Metric
Begin by initializing the histogram metric. In this example, the histogram is named "request_latency_seconds" and includes two label names: "path" and "method." These labels allow you to segment metric data based on the request path and HTTP method.
from prometheus_client import Histogram, start_http_server
import time
from flask import request, Flask


app = Flask(__name__)


LATENCY = Histogram('request_latency_seconds', 'Request Latency', labelnames=['path', 'method'])
Capturing Request Latency
To capture request latency, define two functions. The first function executes before each request, recording the start time. The second function runs after the request and calculates the latency, which is then recorded by the histogram metric.
def before_request():
    request.start_time = time.time()


def after_request(response):
    request_latency = time.time() - request.start_time
    LATENCY.labels(request.method, request.path).observe(request_latency)
    return response
These callback functions are then integrated into the Flask application using app.before_request and app.after_request:
if __name__ == '__main__':
    start_http_server(8000)
    app.before_request(before_request)
    app.after_request(after_request)
    app.run(port=5000)
Detailed Explanation
Before Request Callback:
Thebefore_requestfunction records the current time viatime.time()when a request is received. This timestamp is stored on therequestobject for later use.After Request Callback:
After the request is processed, theafter_requestfunction calculates the latency by subtracting the recorded start time from the current time. It then updates the histogram metric using theobservemethod, with the request's HTTP method and path as labels.
This setup provides a robust mechanism to measure the processing time for each request, thereby enabling effective performance monitoring.
Understanding Default Buckets
When the histogram metric is retrieved—typically via the /metrics endpoint—the output might look similar to the example below:
$ request_latency_seconds
request_latency_seconds_bucket{le="0.005",method="GET",path="/cars"} 0.0
request_latency_seconds_bucket{le="0.01",method="GET",path="/cars"} 0.0
request_latency_seconds_bucket{le="0.025",method="GET",path="/cars"} 0.0
request_latency_seconds_bucket{le="0.05",method="GET",path="/cars"} 1.0
request_latency_seconds_bucket{le="0.075",method="GET",path="/cars"} 3.0
request_latency_seconds_bucket{le="0.1",method="GET",path="/cars"} 3.0
request_latency_seconds_bucket{le="0.25",method="GET",path="/cars"} 4.0
request_latency_seconds_bucket{le="0.5",method="GET",path="/cars"} 6.0
request_latency_seconds_bucket{le="0.75",method="GET",path="/cars"} 6.0
request_latency_seconds_bucket{le="1.0",method="GET",path="/cars"} 8.0
request_latency_seconds_bucket{le="2.5",method="GET",path="/cars"} 8.0
request_latency_seconds_bucket{le="5.0",method="GET",path="/cars"} 8.0
request_latency_seconds_bucket{le="7.5",method="GET",path="/cars"} 8.0
request_latency_seconds_bucket{le="10.0",method="GET",path="/cars"} 8.0
request_latency_seconds_bucket{le="+Inf",method="GET",path="/cars"} 8.0
request_latency_seconds_count{method="GET",path="/cars"} 8.0
The Prometheus client library automatically creates default buckets to group latency values. However, these default settings might not be ideal for all use cases.
Customizing Histogram Buckets
To tailor the histogram to your application's needs, you can customize the bucket boundaries. Just provide a list of bucket boundaries when initializing the metric. The example below demonstrates how to configure custom buckets:
LATENCY = Histogram(
    'request_latency_seconds',
    'Flask Request Latency',
    labelnames=['path', 'method'],
    buckets=[0.01, 0.02, 0.03, 0.04, 0.05, 0.06, 0.07, 0.08, 0.09, 0.1]
)
Configuring a Summary Metric
Configuring a summary metric is very similar to setting up a histogram. The only difference is that you replace Histogram with Summary. Like the histogram, the summary metric uses the observe method after applying the relevant labels.
from prometheus_client import Summary


LATENCY = Summary('request_latency_seconds', 'Flask Request Latency', labelnames=['path', 'method'])


# During the after_request callback
LATENCY.labels(request.method, request.path).observe(request_latency)
Important Note
The Python client library for Prometheus does not implement all the features available for summary metrics, such as configuring quantiles. These features are available in some other language clients.
By following these instructions, you can effectively monitor your Flask application's performance by tracking request latency using both histogram and summary metrics. For additional resources on Prometheus and Flask monitoring, consider exploring Prometheus Documentation and Flask Documentation.
Gauge
In this article, we will demonstrate how to create a gauge metric that monitors the total number of active requests—those currently being processed but not yet completed. A gauge metric is similar to a counter; however, it provides additional flexibility by supporting both increment and decrement operations, as well as allowing you to set a specific value when needed.
Overview
A gauge is especially useful for tracking values that can go up and down, such as the number of in-progress requests on your server.
Gauge Metric Implementation
Below is the Python code that defines a gauge metric for in-progress requests along with two functions that update the metric during the request lifecycle:
IN_PROGRESS = Gauge('inprogress_requests',
                    'Total number of requests in progress',
                    labelnames=['path', 'method'])


def before_request():
    IN_PROGRESS.labels(request.method, request.path).inc()
    request.start_time = time.time()


def after_request(response):
    IN_PROGRESS.labels(request.method, request.path).dec()
    return response
Implementation Details
Gauge Initialization:
The gauge metric, namedinprogress_requests, is initialized with a description and two labels:pathandmethod. These labels allow you to differentiate the number of active requests based on the request URL path and HTTP method.before_request Function:
This function is invoked at the beginning of every request. It increments the gauge for the correspondingmethodandpath, and records the request's start time.after_request Function:
When a request completes, this function is triggered to decrement the gauge, thus reflecting the decrease in active requests.
Key Consideration
Ensure that the before_request and after_request functions are correctly integrated with your web framework's request lifecycle hooks.
Monitoring the Gauge Metric
When querying the metric (for example, with Prometheus), you might receive an output like the following. This output displays the number of active requests per HTTP method and path:
$ inprogress_requests
inprogress_requests{method="GET",path="/cars"} 3.0
inprogress_requests{method="POST",path="/cars"} 0.0
inprogress_requests{method="POST",path="/boats"} 18.0
inprogress_requests{method="GET",path="/boats"} 7.0
This example clearly demonstrates how the gauge metric differentiates active requests based on the HTTP method and request path, providing a detailed insight into your application's current processing state.
Additional Resources
By following these guidelines, you can effectively monitor and analyze the number of active requests in your application, leading to improved performance tracking and system reliability.
Best Practice
In this article, we explain the best practices for naming your metrics to ensure consistency, clarity, and ease in tracking. A standardized naming convention makes it easier to understand and interpret the data collected from various systems.
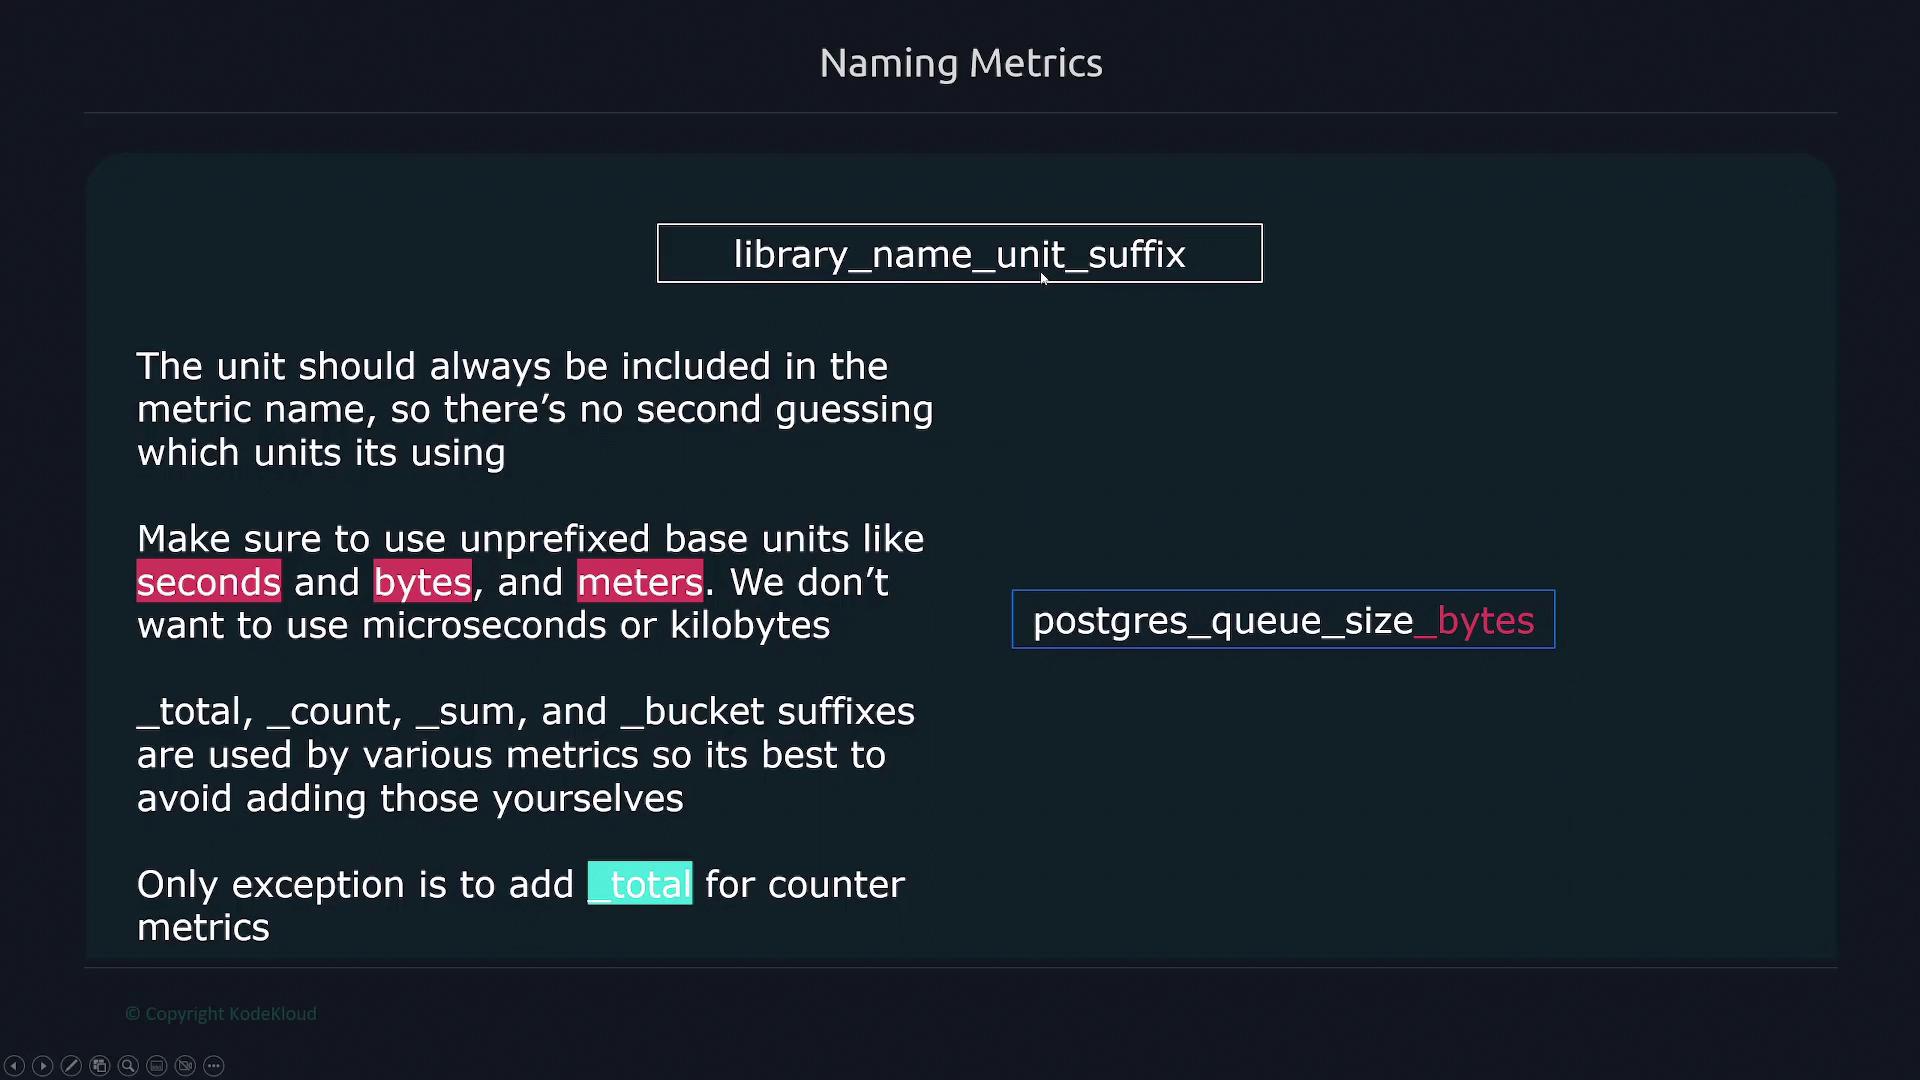
Naming Convention
Metric names must be written in snake_case, meaning all letters are lowercase and words are separated by underscores. For instance, the metric name http_requests_total follows this convention.
The structure for naming metrics should be:
The first term represents the application or library associated with the metric. For example, metrics related to PostgreSQL should start with
postgresql_.Subsequent terms describe what the metric measures, such as
queue_size.Always append the unit of measurement (e.g., seconds, bytes, meters) to avoid misinterpretation. This ensures clarity, such as distinguishing between seconds and milliseconds.
Use unprefixed base units (like seconds, bytes, meters) rather than their prefixed counterparts (such as microseconds or kilobytes).
Avoid applying special suffixes like
_total,_count,_sum, and_bucketto custom names except that counter metrics should end with_total. Other metric types, including histograms, should not use these suffixes unless required.
The standard naming format includes the library name, a description, a unit, and, where applicable, an appropriate suffix.
Examples of Metric Names
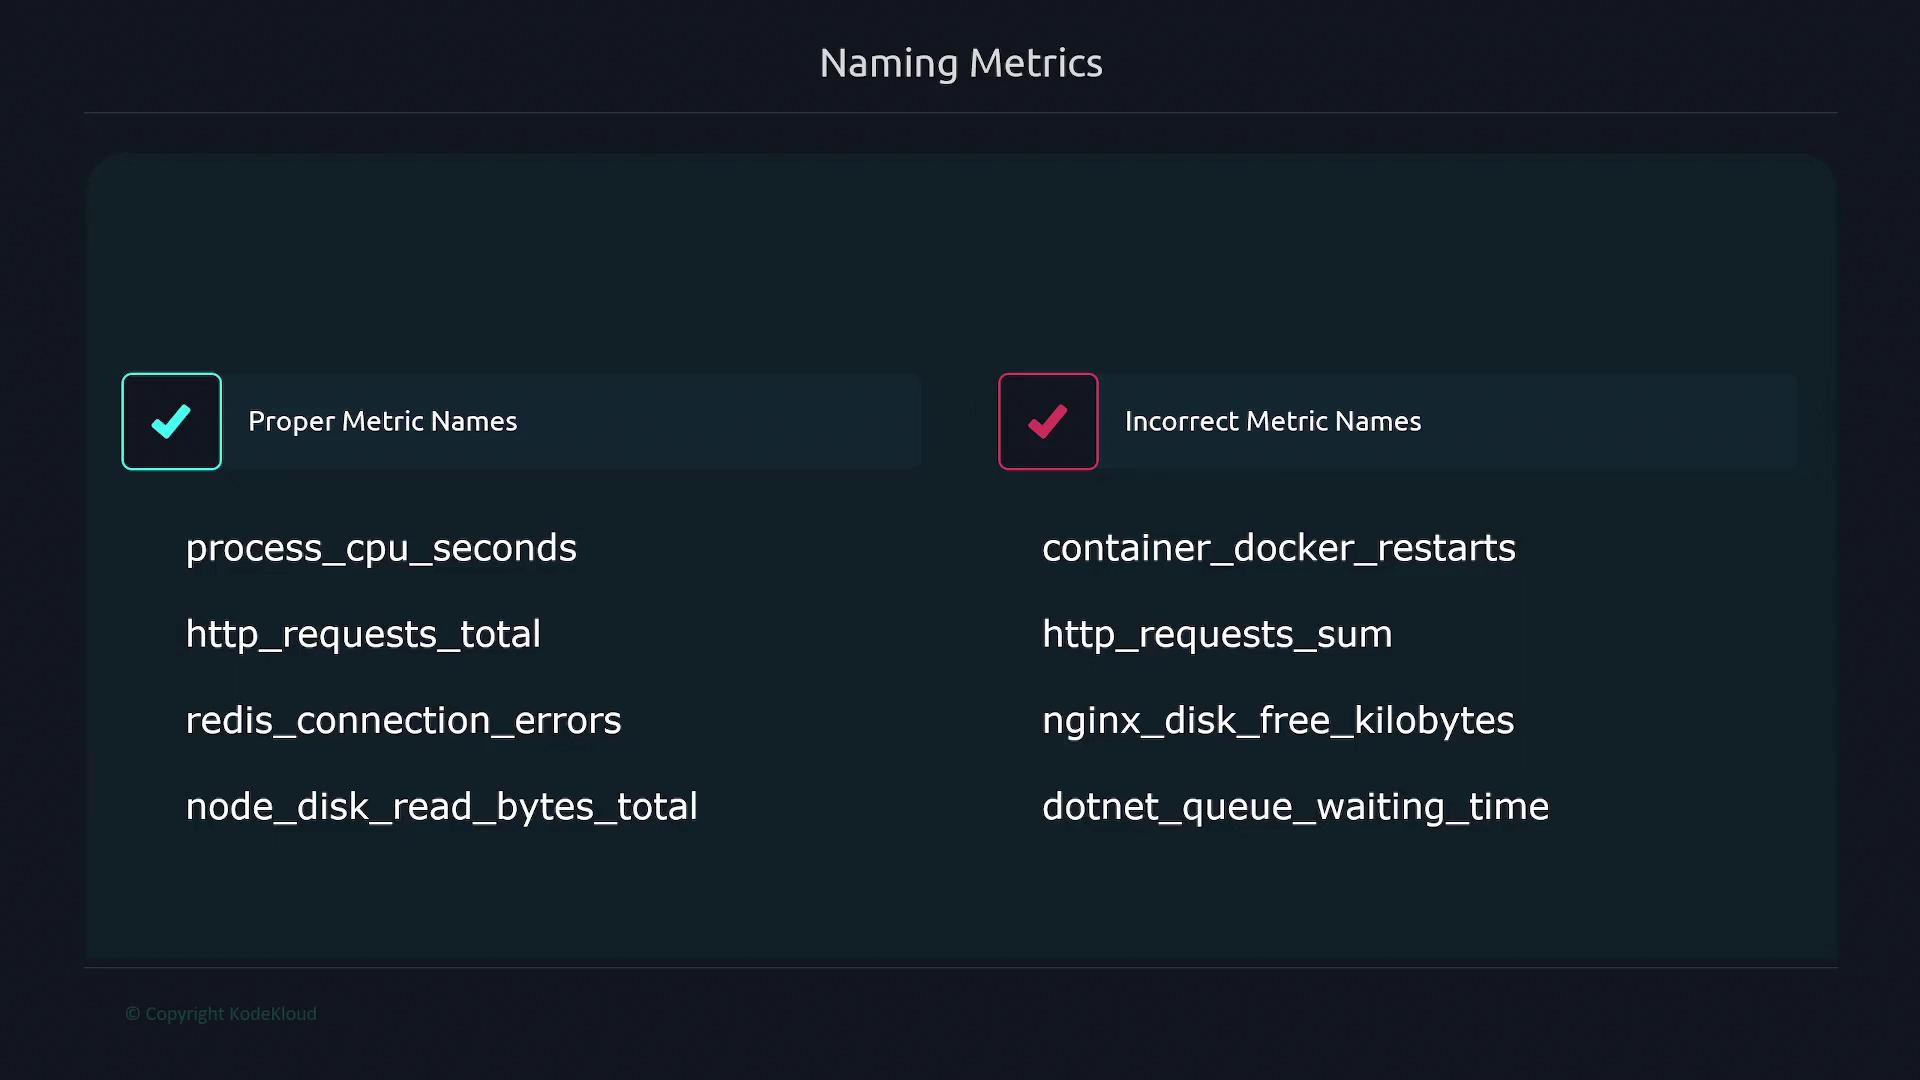
Below are some well-crafted examples that adhere to these conventions:
process_cpu_seconds
http_requests_total
redis_connection_errors
process_cpu_secondsuses snake_case, begins with the application/library (process), and includes the unitseconds.http_requests_totalstarts with the relevant component (http), describes the metric (requests), and appropriately ends with_totalfor a counter metric.redis_connection_errorsclearly identifies the system (Redis) and describes the error type.
Additional Guidance
For tracking connection errors as a counter metric, you might use redis_connection_errors_total. In the case of node_disk_read_bytes_total, the name effectively highlights the source (Node), the measured metric (disk read bytes), and marks it as a counter with _total.
Conversely, avoid names that deviate from these guidelines:
Bad Example:
container Docker restarts
Recommendation: Use snake_case and place the library name first. Instead, usedocker_container_restarts.Bad Example:
HTTP_request_sum
Recommendation: Do not use terms likesumwhich could lead to confusion.Bad Example:
nginx_disk_free_kilobytes
Recommendation: Replacekilobyteswith the base unitbytes.Bad Example:
.NET queue waiting time
Recommendation: Always include the unit for clarity.
What to Instrument
Choosing what to instrument depends on your system's type and its requirements. Metrics should be tailored to the specific operational context. Generally, there are three main types of applications:
1. Online Serving Systems
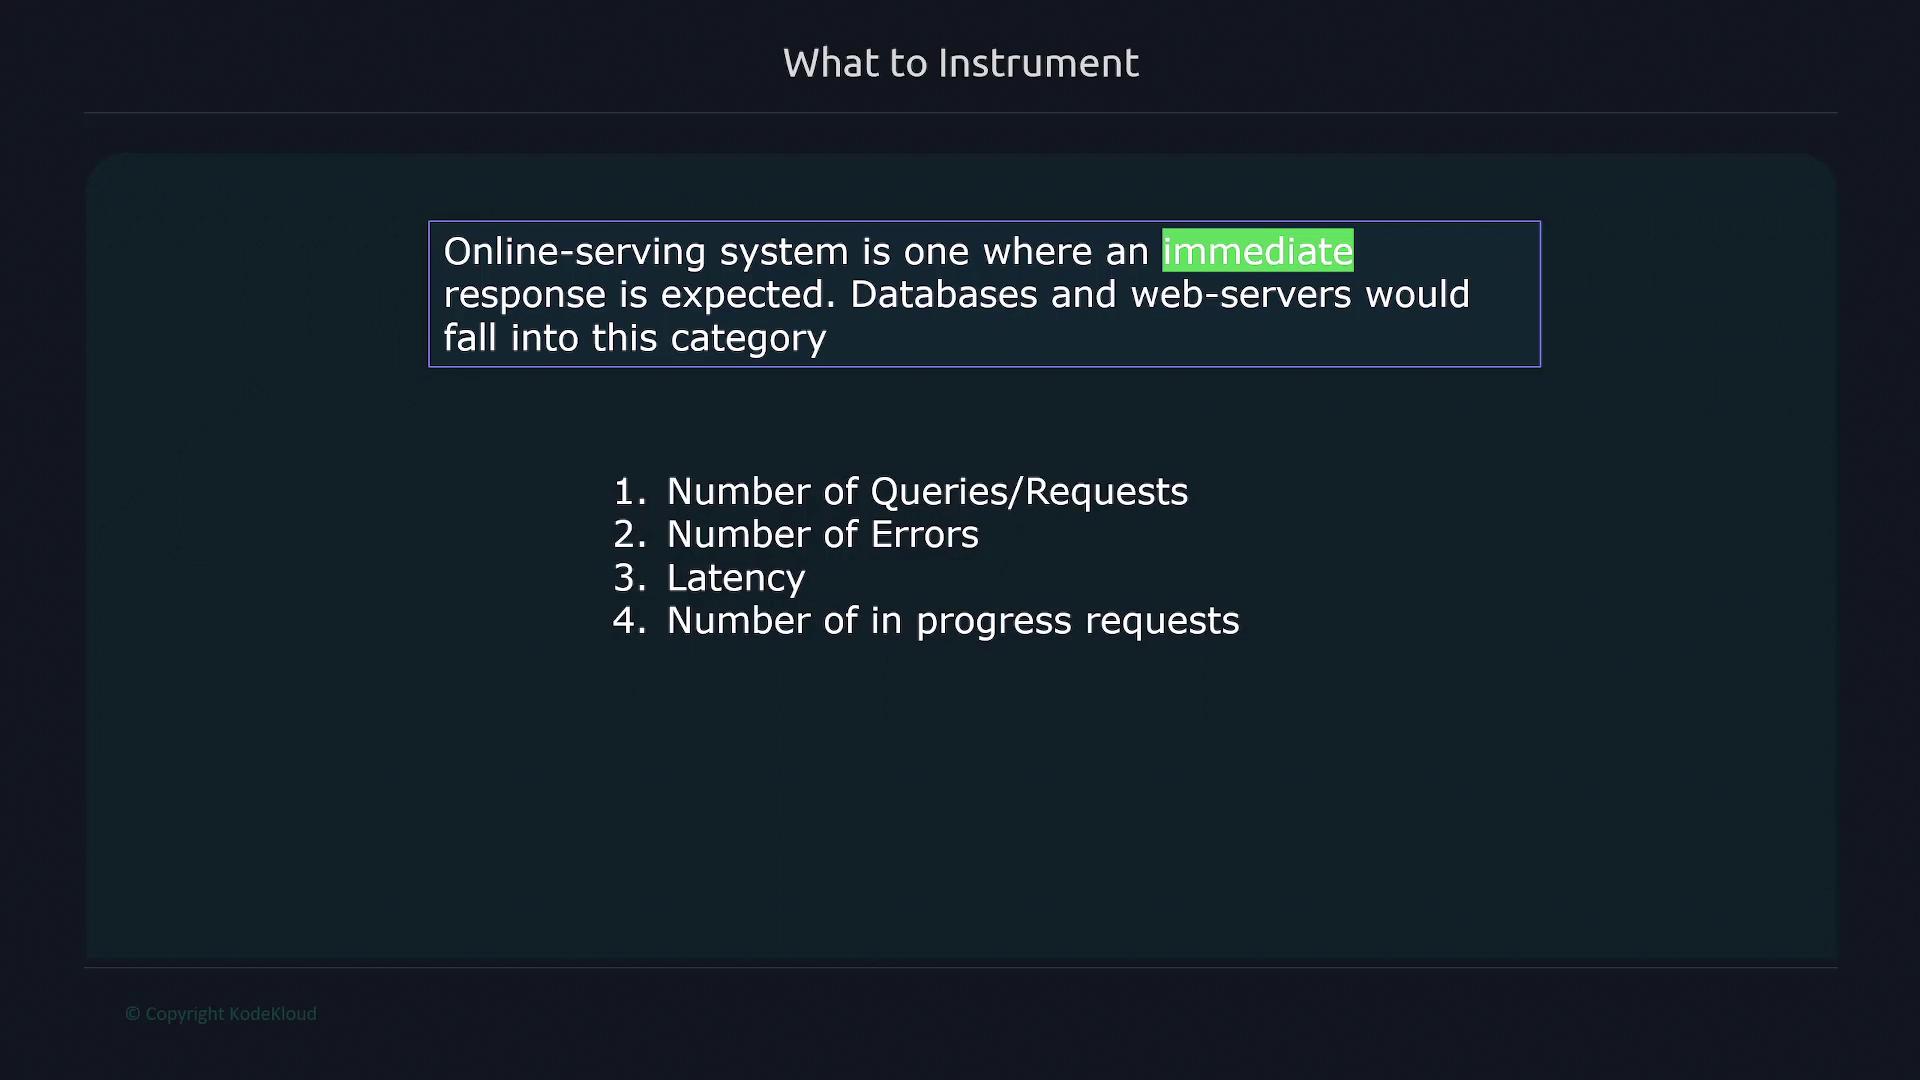
Online serving systems require immediate responses. They include components such as databases, web servers, and APIs. Common metrics for these systems include:
Total number of requests or queries
Number of errors
Latency measurements
Number of in-progress requests
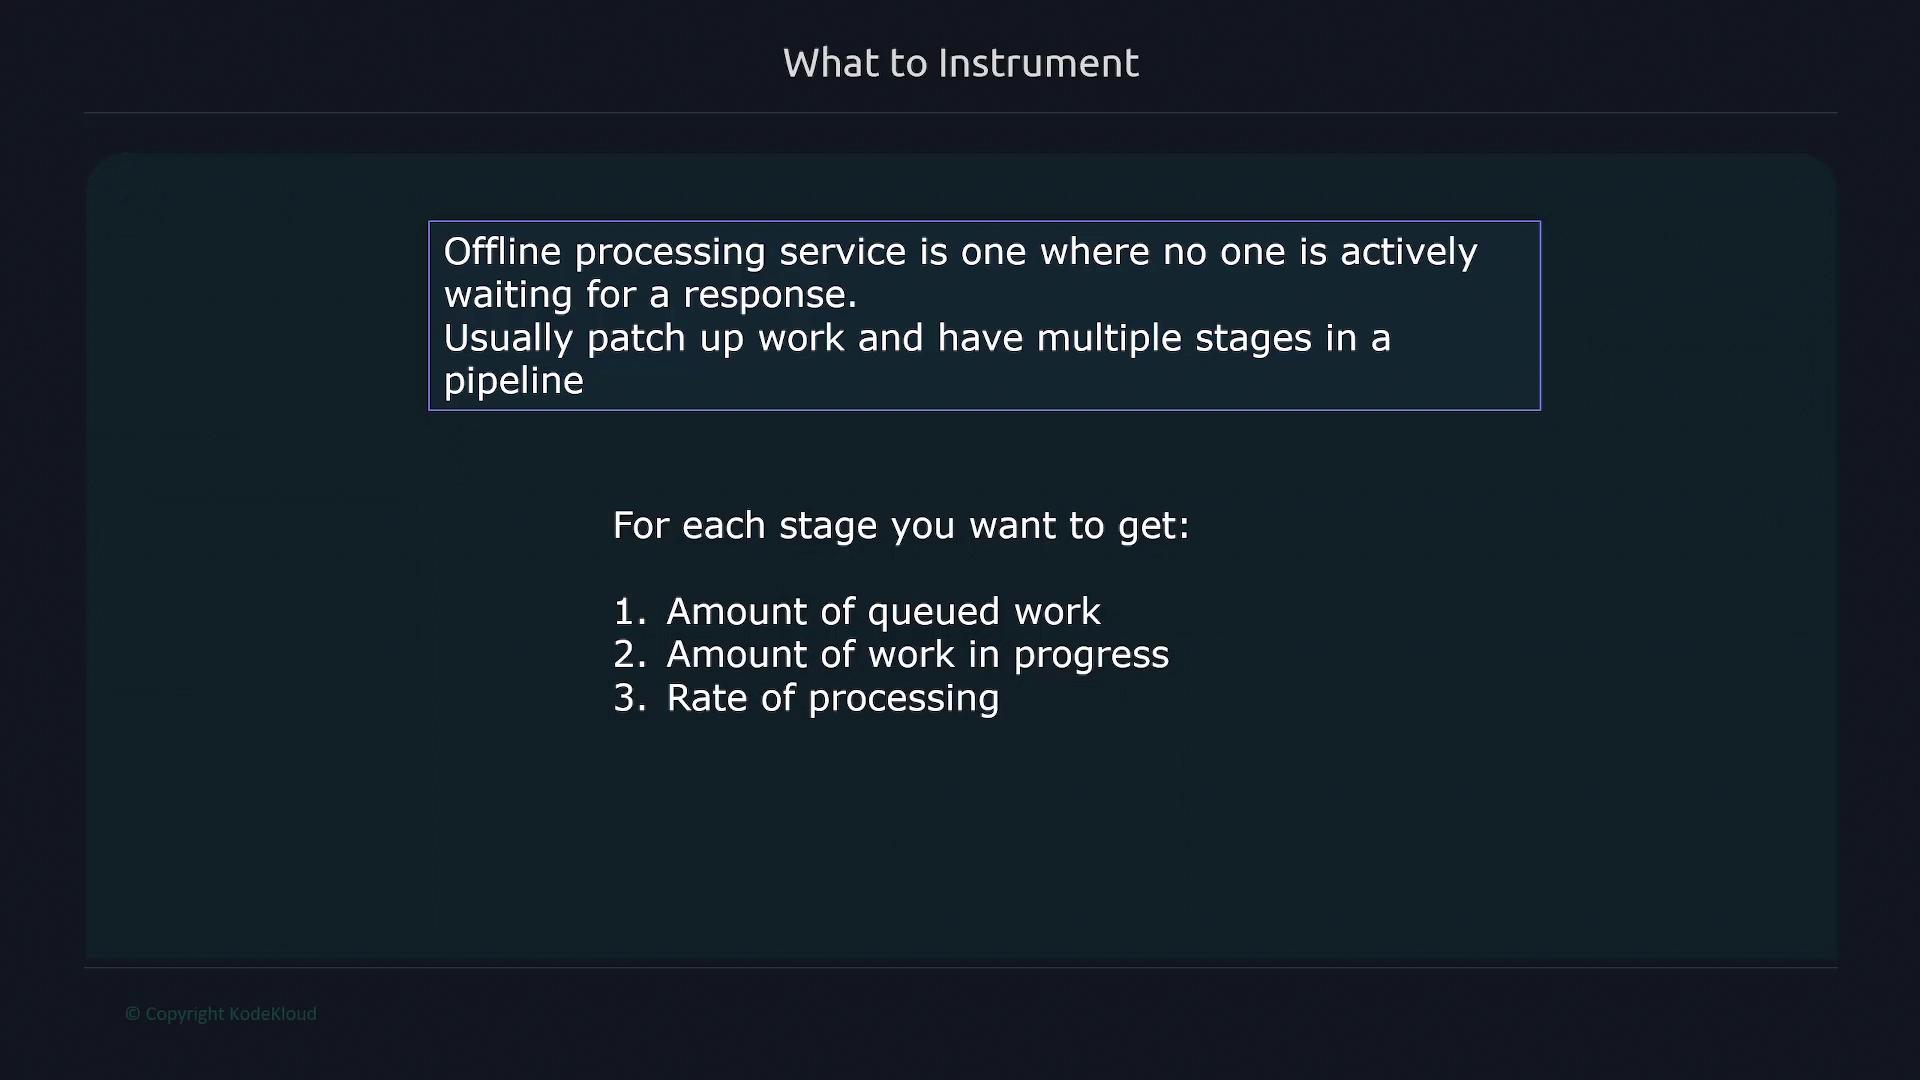
2. Offline Processing Services
Offline processing services are used where immediate responses are not required. These systems typically perform batch processes involving multiple stages. Metrics to consider include:
Total amount of work to be done
Volume of queued work
Number of work items in progress
Processing rates
Errors at various processing stages
3. Batch Jobs
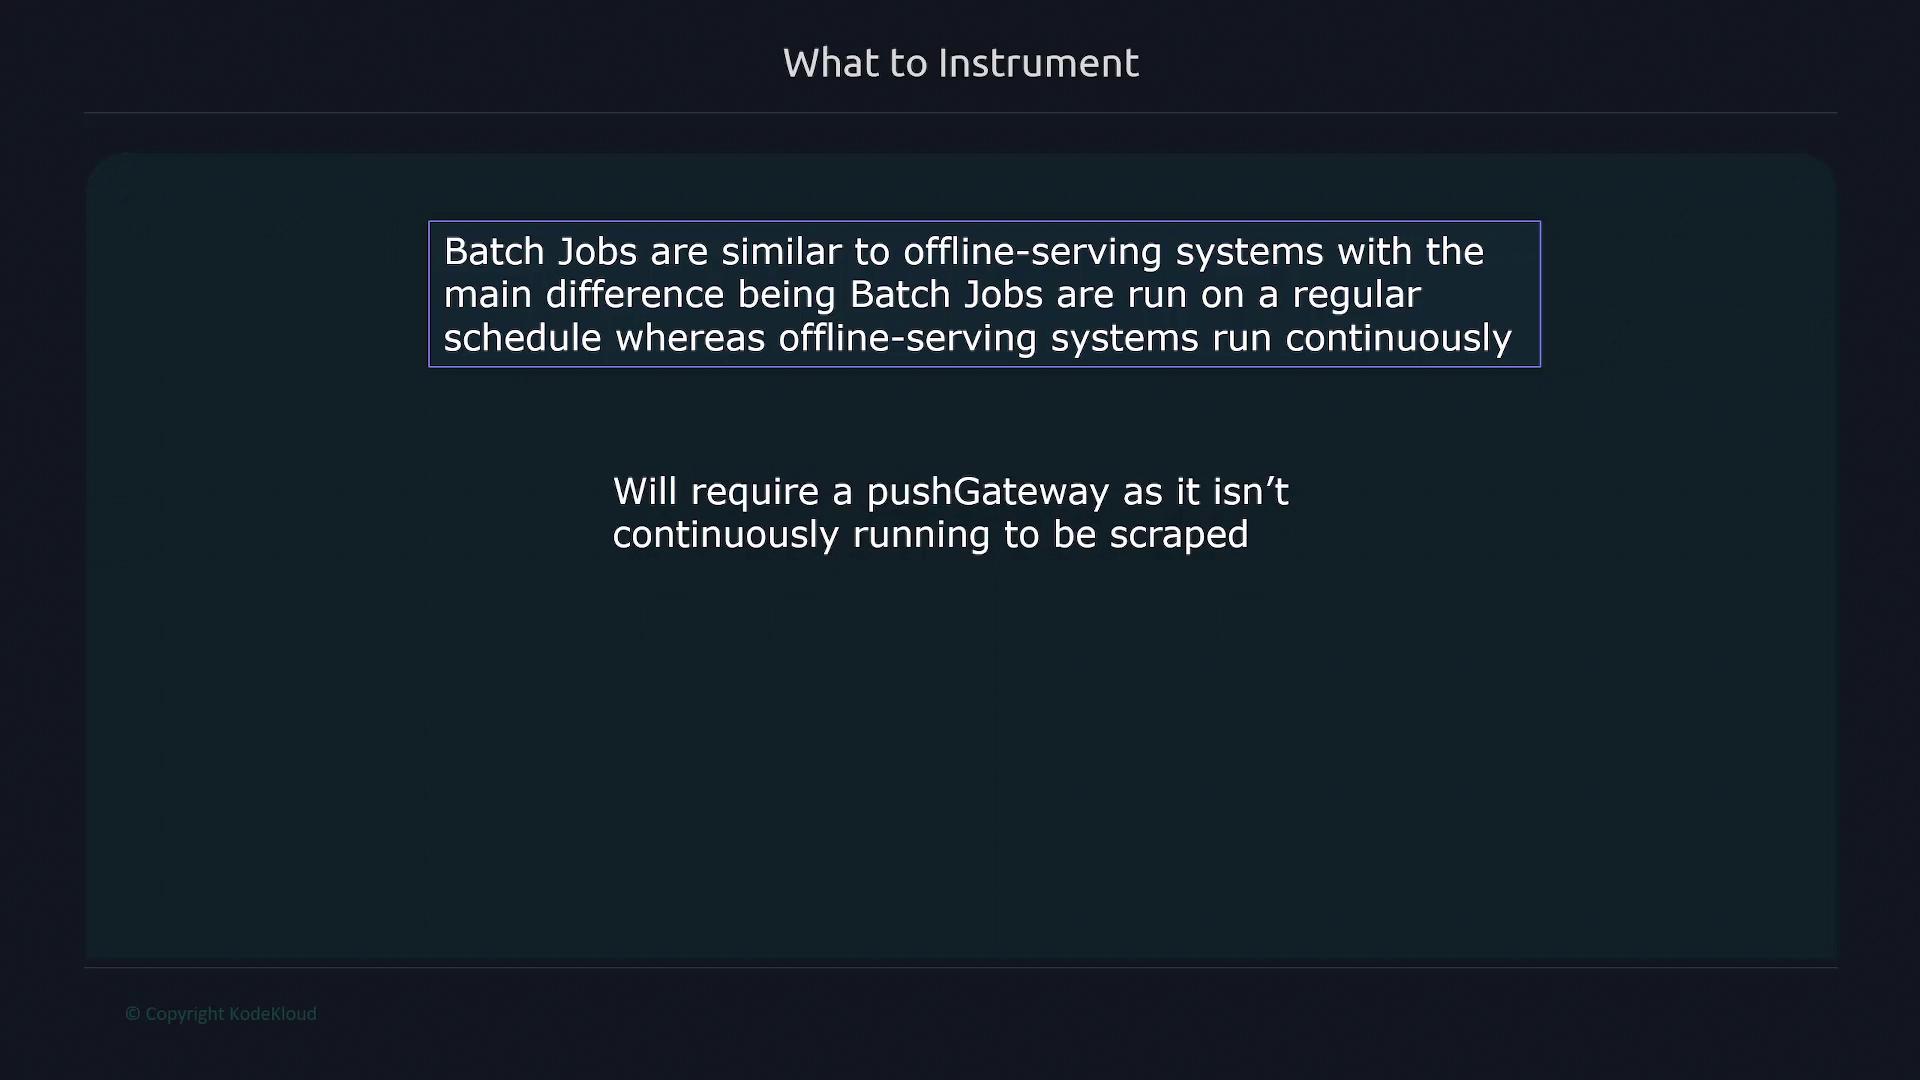
Batch jobs are scheduled to run at specific intervals rather than continuously. Because batch jobs do not run continuously, using a Push Gateway is often recommended for effective data collection. Key metrics for batch jobs should include:
Time spent processing each stage of the job
Overall runtime of the job
Timestamp of the last job completion
Final Thoughts
Implementing these best practices ensures that your metrics are consistently named and accurately monitored, ultimately improving observability and simplifying troubleshooting across your systems.


