4. Dashboarding Visualization

🚀 Aspiring DevOps & Cloud Engineer | Passionate about Automation, CI/CD, Containers, and Cloud Infrastructure ☁️ I work with Docker, Kubernetes, Jenkins, Terraform, AWS (IAM & S3), Linux, Shell Scripting, and Git to build efficient, scalable, and secure systems. Currently contributing to DevOps-driven projects at Assurex e-Consultant while continuously expanding my skills through hands-on cloud and automation projects. Sharing my learning journey, projects, and tutorials on DevOps, AWS, and cloud technologies to help others grow in their tech careers. 💡 Let’s learn, build, and innovate together!
Introduction
In this article, we dive into the powerful visualization tools provided by Prometheus. These built-in features allow you to transform raw metric data into insightful graphs, tables, and dashboards, making it easier to identify trends and patterns that might otherwise be overlooked.
Visualizing your data is essential because humans are naturally inclined to process information visually. By using tools that present metrics in an intuitive format, you can quickly gain insights into system performance and potential issues.
One of the primary visualization tools included with Prometheus is the expression browser. This built-in feature enables you to rapidly explore and query metric data, providing a straightforward method for data investigation.
Below is an illustration that outlines various visualization methods available with Prometheus. It highlights both native tools—such as the Expression Browser and Console Templates—and popular third-party alternatives:
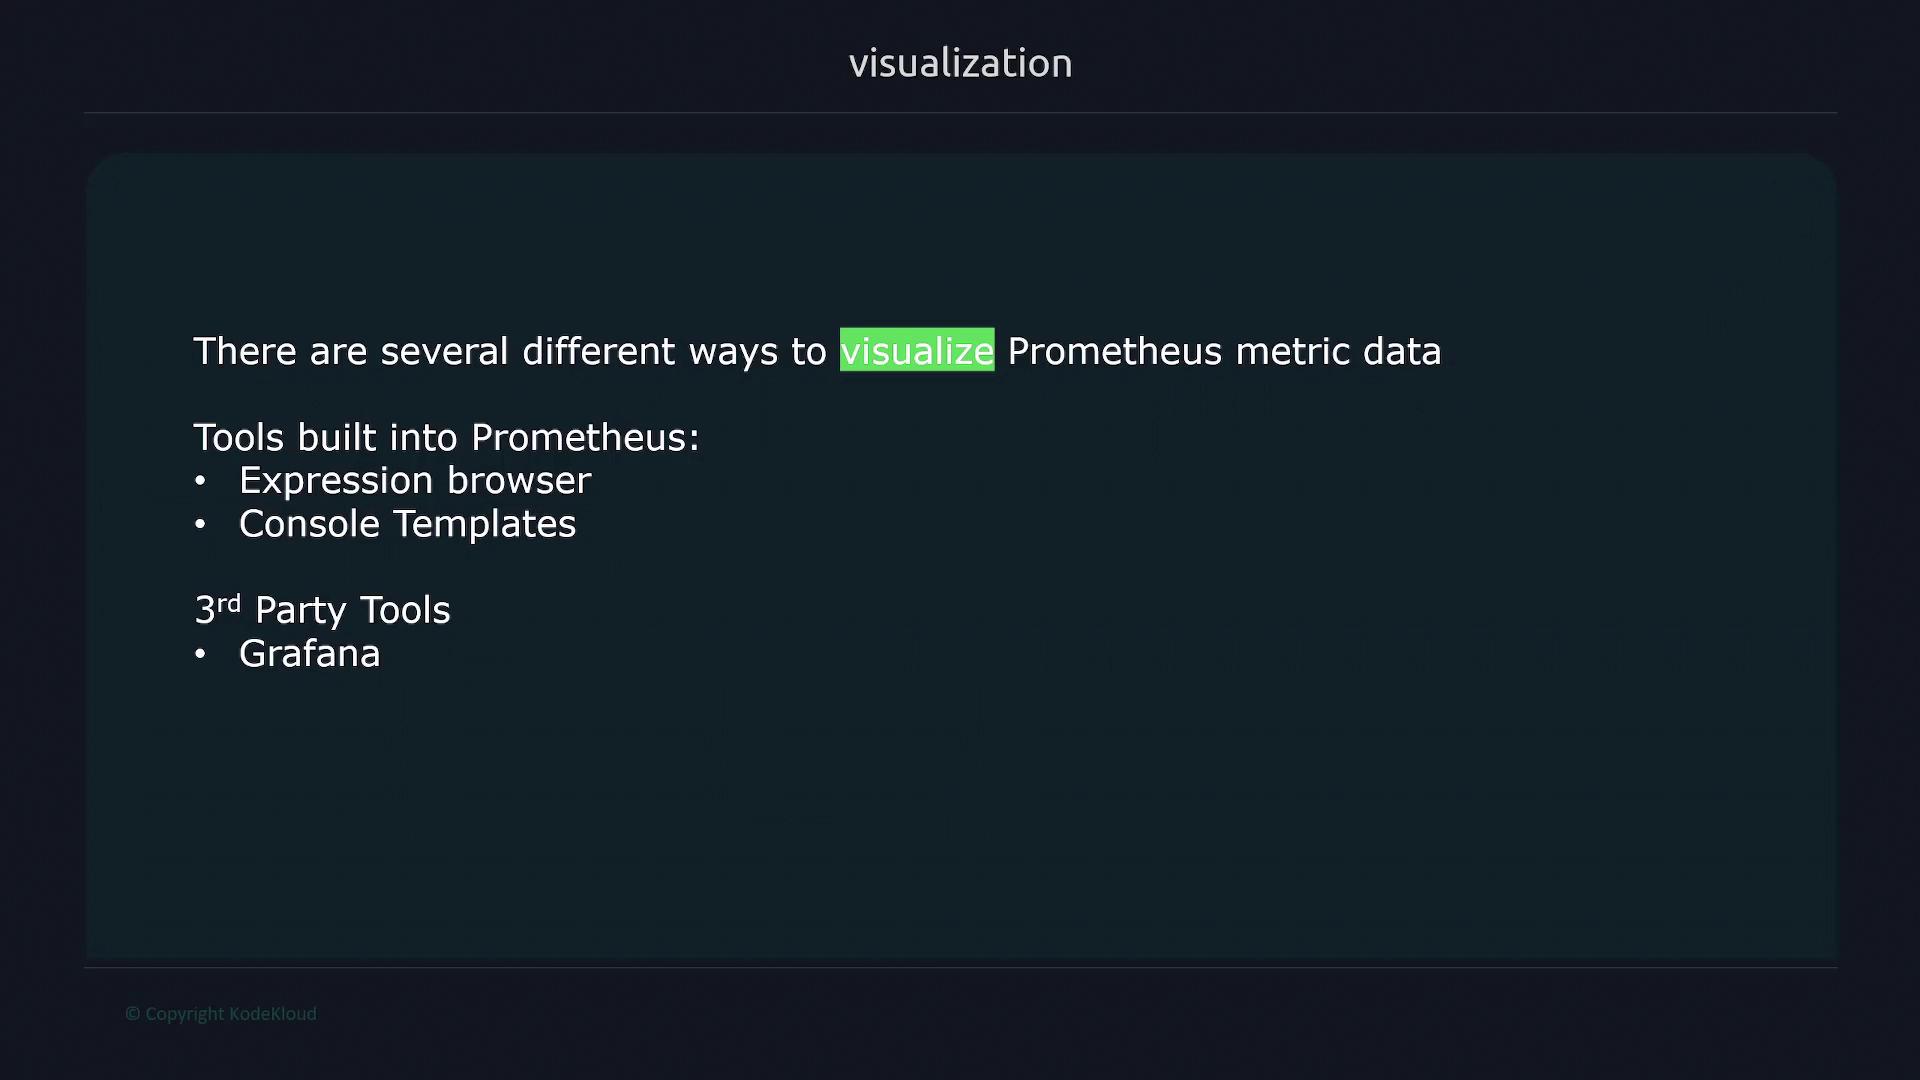
Another powerful built-in feature is console templates. These allow you to craft custom mini web pages that showcase preconfigured graphs, offering tailored visualization options for your specific monitoring needs.
For those requiring even more advanced visualization capabilities, third-party tools like Grafana are highly recommended. Exclusively designed for robust data visualization, Grafana provides extensive support for Prometheus data, along with deep customization possibilities. This enables you to design comprehensive dashboards that offer a complete view of the metrics critical to your system's performance.
Note
For more details on configuring Prometheus and integrating it with these visualization tools, visit the Prometheus Documentation.
Expression Browser
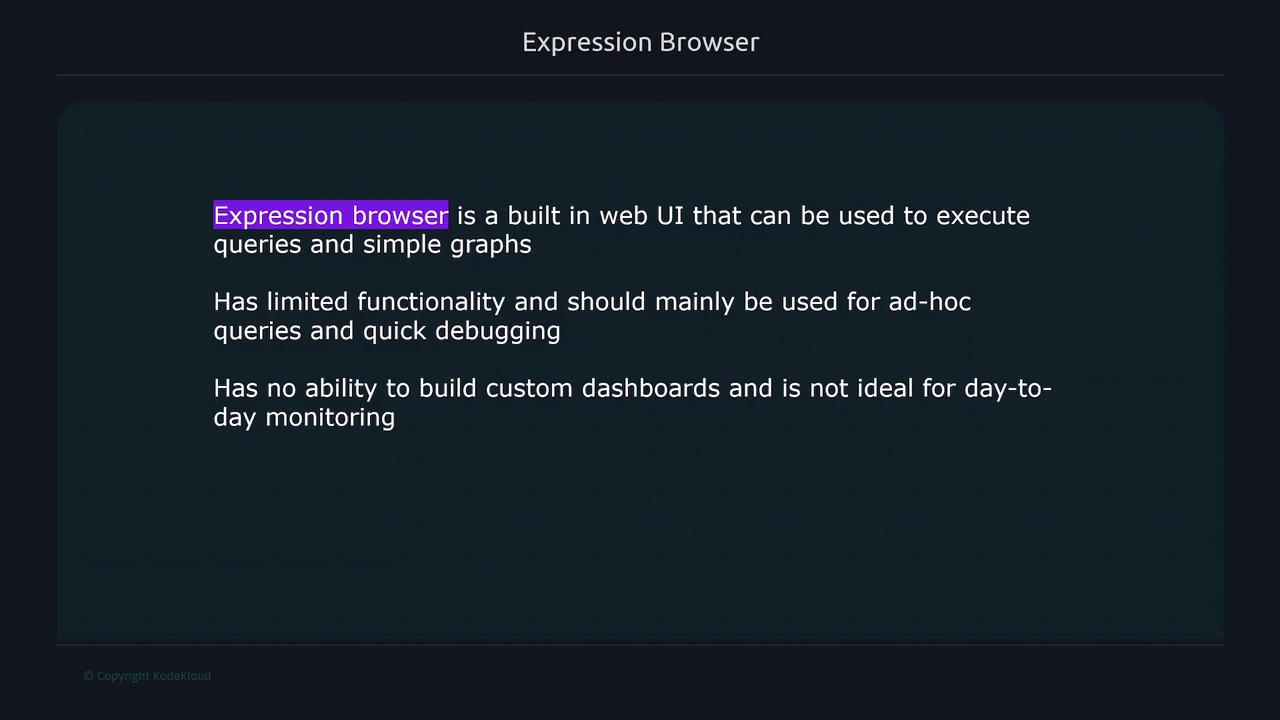
The Expression Browser is a built-in web UI provided by Prometheus that allows you to execute ad hoc PromQL queries and generate simple graphs. While it offers only basic functionality, it is an ideal tool for quick debugging and one-off queries. However, note that it is not designed for building custom dashboards or handling day-to-day monitoring.
Accessing the Expression Browser
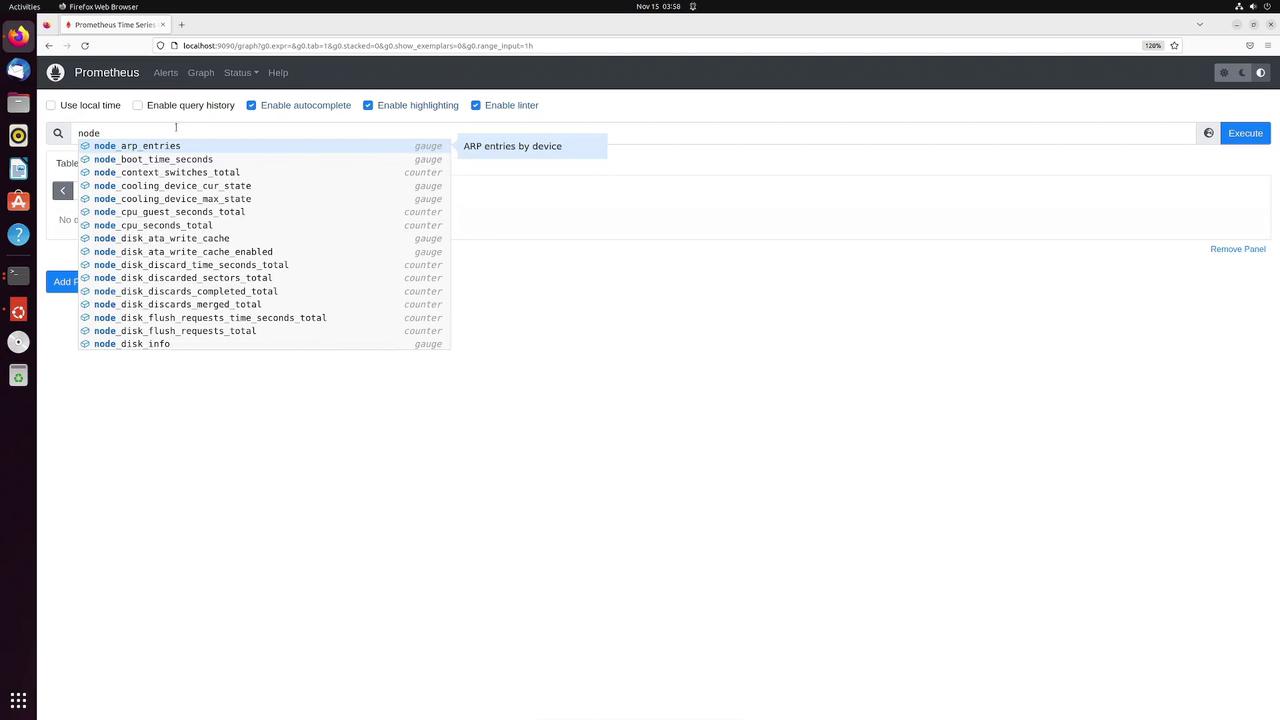
To get started, open your web browser and navigate to the IP address of your Prometheus server along with the appropriate port number. This action loads the Expression Browser interface, where you can input any PromQL query.
For instance, type "node" into the query editor. With autocomplete enabled, the interface will suggest available metrics that begin with "node" along with their types. If autocomplete is disabled, these suggestions will not appear.
Tip
When testing queries with autocomplete, ensure it is enabled in your browser settings to maximize efficiency.
Executing Queries
You can run an arbitrary query such as:
node_memory_Active_bytes{instance="192.168.1.168:9100", job="node"}
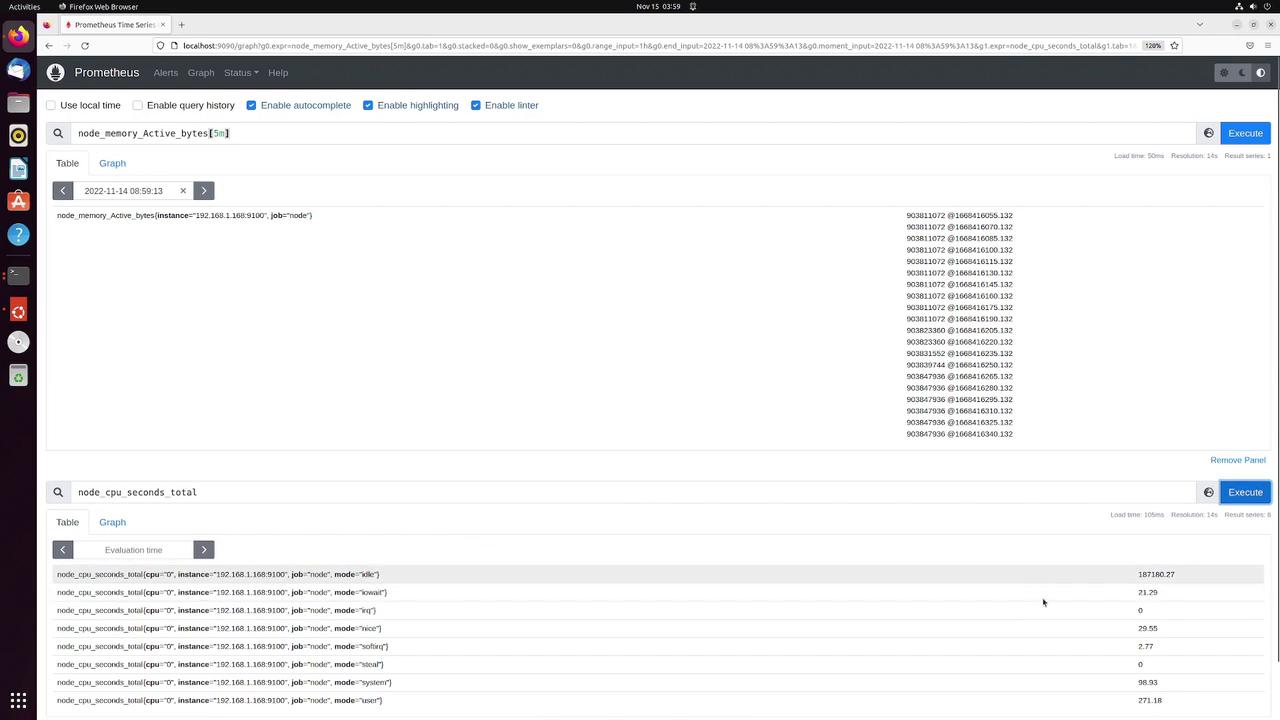
When executed, the Expression Browser displays the corresponding metric along with all its associated labels and the current value. To see historical data, simply select a different evaluation time from the dropdown menu—for example, viewing the metric value from one day ago.
For a more detailed analysis over a specific period (such as the past five minutes), adjust the query to retrieve a range vector. The Expression Browser will then display the corresponding time series data.
Working with Multiple Panels
The Expression Browser also supports multiple panels, enabling side-by-side comparisons of query results. For example, after executing your first query, add another panel and run a query like:
node_cpu_seconds_total
Hint
Using multiple panels can help you quickly compare metrics such as memory usage and CPU load for more effective troubleshooting.
Visualizing Data with the Graph Page
To enhance your analysis, navigate to the Graph page where you can visualize metric data. Consider the following query:
node_memory_Active_bytes{instance="192.168.1.168:9100", job="node"}
This query returns a range vector, but the Graph page is designed to display an instant vector. To resolve this, modify the query or apply a function. A common approach is to use the rate function to calculate the change over time:
rate(node_memory_Active_bytes[5m])
Running the above query depicts the rate of change over a five-minute interval. You can further customize the graph’s time window (for example, 30 minutes or 2 hours) or specify a custom evaluation time via the time picker.
The graph page also includes a legend that clearly identifies each series, particularly when graphing multiple series with various labels. For example, graphing:
rate(node_memory_Active_bytes[5m])
will display detailed metric labels in the legend. To further illustrate, consider graphing the CPU rate over a two-minute interval:
rate(node_cpu_seconds_total[2m])
Although this graph may seem less dynamic if the values are steady, the legend will still distinctly represent each node’s CPU metric.
Conclusion
In summary, the Expression Browser is a straightforward and effective tool for executing quick PromQL queries and generating basic graphs. While it may not support advanced dashboarding, it remains an essential resource for rapid troubleshooting and on-demand monitoring.
For further details on Prometheus and PromQL, refer to the Prometheus Documentation.
Console Templates
This article provides an in-depth look at Prometheus's alternative built-in visualization tool—console templates. With console templates, you can create custom HTML pages using the Go templating language. These pages can embed various metrics, queries, and charts, enabling you to design personalized dashboards that prominently display your desired data.
By navigating to /etc/prometheus/consoles, you can explore several pre-built templates. These templates allow you to construct individual blocks for different parts of a webpage—such as headers, charts, tables, footers, or sidebars—so you can assemble a complete dashboard focused on your specific monitoring needs.
$ ls /etc/prometheus/consoles
drwxr-xr-x  2 user1 user1  4096 Oct  7 12:24  .
drwxr-xr-x  5 user1 user1  4096 Oct 17 22:23  ..
-rw-r--r--  1 user1 user1   616 Oct  7 12:24  index.html.example
-rw-r--r--  1 user1 user1  2675 Oct  7 12:24  node-disk.html
-rw-r--r--  1 user1 user1  3522 Oct  7 12:24  node.html
-rw-r--r--  1 user1 user1  1453 Oct  7 12:24  node-overview.html
-rw-r--r--  1 user1 user1  5783 Oct  7 12:24  prometheus.html
-rw-r--r--  1 user1 user1  4103 Oct  7 12:24  prometheus-overview.html
Each file corresponds to a different template. For example, the file index.html.example includes the following structure using the Go templating language:
{{ template "head" . }}
{{ template "prom_right_table_head" }}
{{ template "prom_right_table_tail" }}
{{ template "prom_content_head" . }}


<h1>Overview</h1>
<p>These are example consoles for Prometheus.</p>
<p>These consoles expect exporters to have the following job labels:</p>


<table class="table table-sm table-striped table-bordered" style="width: 0%">
  <tr>
    <th>Exporter</th>
    <th>Job label</th>
  </tr>
  <tr>
    <td>Node Exporter</td>
    <td><code>node</code></td>
  </tr>
  <tr>
    <td>Prometheus</td>
    <td><code>prometheus</code></td>
  </tr>
</table>


{{ template "prom_content_tail" . }}
{{ template "tail" }}
When you list the files in the /etc/prometheus/consoles folder, you will notice several pages similar to the example:
user1 in /etc/prometheus
➜  ls -l /etc/prometheus/console/
total 40
-rw-r--r--  1 root      root        383 Nov 15 04:42 demo.html
-rw-r--r--  1 prometheus prometheus 616 Nov 12 23:20 index.html.example
-rw-r--r--  1 prometheus prometheus 2675 Nov 12 23:20 node-cpu.html
-rw-r--r--  1 prometheus prometheus 3522 Nov 12 23:20 node-disk.html
-rw-r--r--  1 prometheus prometheus 1453 Nov 12 23:20 node.html
-rw-r--r--  1 prometheus prometheus 5783 Nov 12 23:20 node-overview.html
-rw-r--r--  1 prometheus prometheus 1334 Nov 12 23:20 prometheus.html
-rw-r--r--  1 prometheus prometheus 4103 Nov 12 23:20 prometheus-overview.html
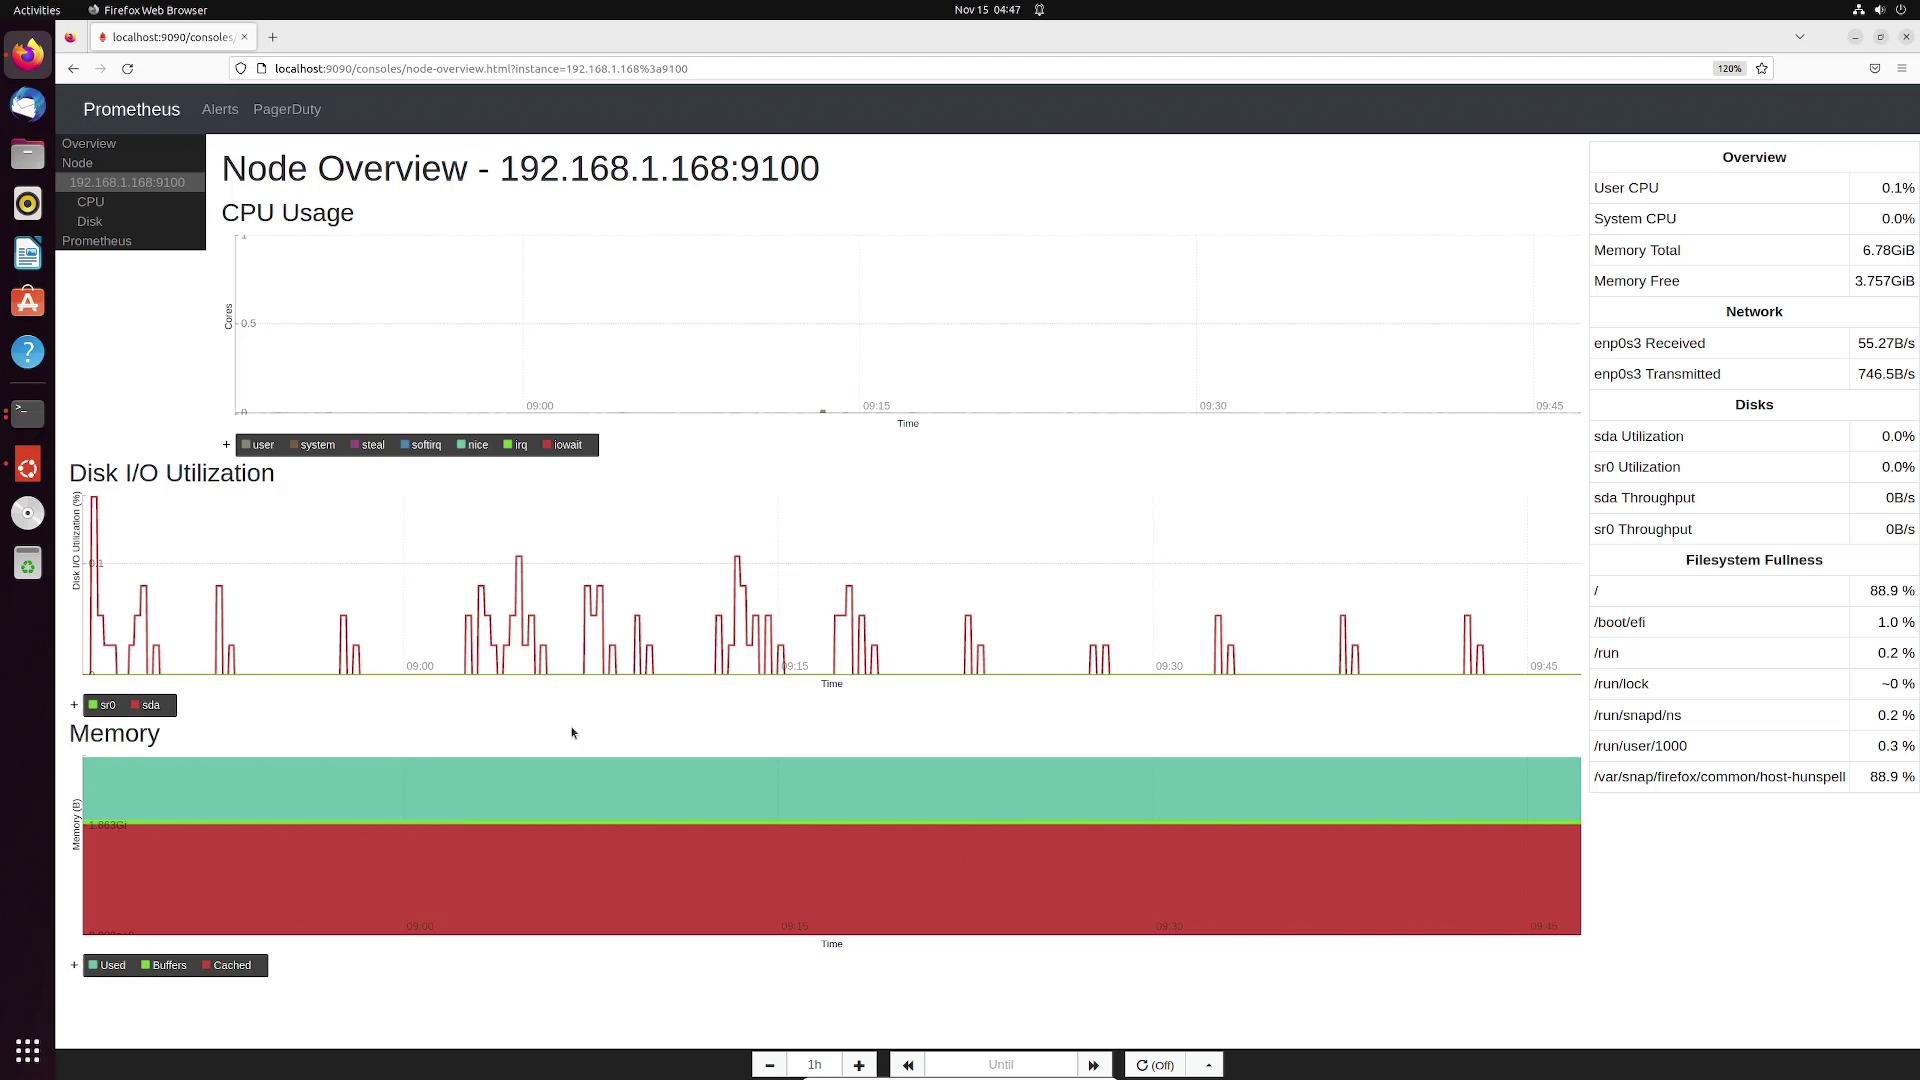
When you access the /consoles path on your Prometheus server and select a file (for example, index.html.example), the console template will render in action. It displays the defined jobs—such as one labeled node (using Node Exporter) and another called Prometheus—along with various options. Clicking on a job navigates to a detailed dashboard that includes metrics like CPU utilization, disk I/O, memory usage, and more.
Tip
Using console templates simplifies the creation of dashboards by allowing you to reuse predefined components and embed dynamic data quickly.
Creating a Custom Console Template
To customize your own dashboard, start by navigating to the Prometheus consoles folder and create a new template file named demo.html (or use a name of your choice):
user1 in  /etc/prometheus/consoles
> cd /etc/prometheus/consoles/
user1 in  /etc/prometheus/consoles
> ls
index.html.example  node-cpu.html  node-disk.html  node.html  node-overview.html  prometheus.html  prometheus-overview.html
user1 in  /etc/prometheus/consoles
> sudo vi demo.html
Initially, the file might contain boilerplate code similar to the following:
{{template "head" .}}
{{template "prom_content_head" . }}
{{template "prom_content_tail" . }}
{{template "tail"}}
These template calls add a standard header and footer to your HTML page. To personalize the page, remove any unnecessary sections and integrate your own HTML content. For instance, you could modify the file to include a custom header:
{{template "head" .}}
{{template "prom_content_head" .}}
<h1>Memory details</h1>
{{template "prom_content_tail" .}}
{{template "tail"}}
Inserting Dynamic Prometheus Data
To display dynamic metric data, you can integrate a PromQL query drilldown. This feature displays the query result and links to the Prometheus expression browser for further inspection. For example, to show the "active memory" metric using the node_memory_Active_bytes query, update your template as follows:
{{template "head" .}}
{{template "prom_content_head" .}}
<h1>Memory details</h1>
active memory: {{template "prom_query_drilldown" (args "node_memory_Active_bytes")}}
{{template "prom_content_tail" .}}
{{template "tail"}}
The drilldown template accepts a single argument, which is the PromQL expression you want to execute.
Adding a Chart
Enhance your dashboard further by adding a chart for visualizing metric trends. To do this, reopen your demo.html file and insert the following code:
{{template "head" .}}
{{template "prom_content_head" .}}
<h1>Memory details</h1>
active memory: {{template "prom_query_drilldown" (args "node_memory_Active_bytes")}}


<div id="graph"></div>


<script>
new PromConsole.Graph({
    node: document.querySelector("#graph"),
    expr: 'rate(node_memory_Active_bytes[2m])'
})
</script>
{{template "prom_content_tail" .}}
{{template "tail"}}
In this enhanced template:
The
<div>with the ID "graph" acts as a placeholder for the chart.A JavaScript block creates a new graph using
new PromConsole.Graph({...})with the following parameters:The
nodeparameter locates the<div>container usingdocument.querySelector("#graph").The
exprparameter supplies the PromQL queryrate(node_memory_Active_bytes[2m])to fetch the metric data.
After saving the file, accessing demo.html via your Prometheus server will display your custom dashboard. The page will include a header, the "Memory details" section showing the dynamic active memory metric, and an interactive chart that visualizes changes in active memory over a two-minute interval. Clicking on the metric value redirects you to the Prometheus expression browser for additional insights.
Note
This example demonstrates how simple it is to customize Prometheus dashboards using console templates. Use this foundation to monitor any metrics specific to your environment.


