1. Observability Fundamentals

🚀 Aspiring DevOps & Cloud Engineer | Passionate about Automation, CI/CD, Containers, and Cloud Infrastructure ☁️ I work with Docker, Kubernetes, Jenkins, Terraform, AWS (IAM & S3), Linux, Shell Scripting, and Git to build efficient, scalable, and secure systems. Currently contributing to DevOps-driven projects at Assurex e-Consultant while continuously expanding my skills through hands-on cloud and automation projects. Sharing my learning journey, projects, and tutorials on DevOps, AWS, and cloud technologies to help others grow in their tech careers. 💡 Let’s learn, build, and innovate together!
Intro to Observability
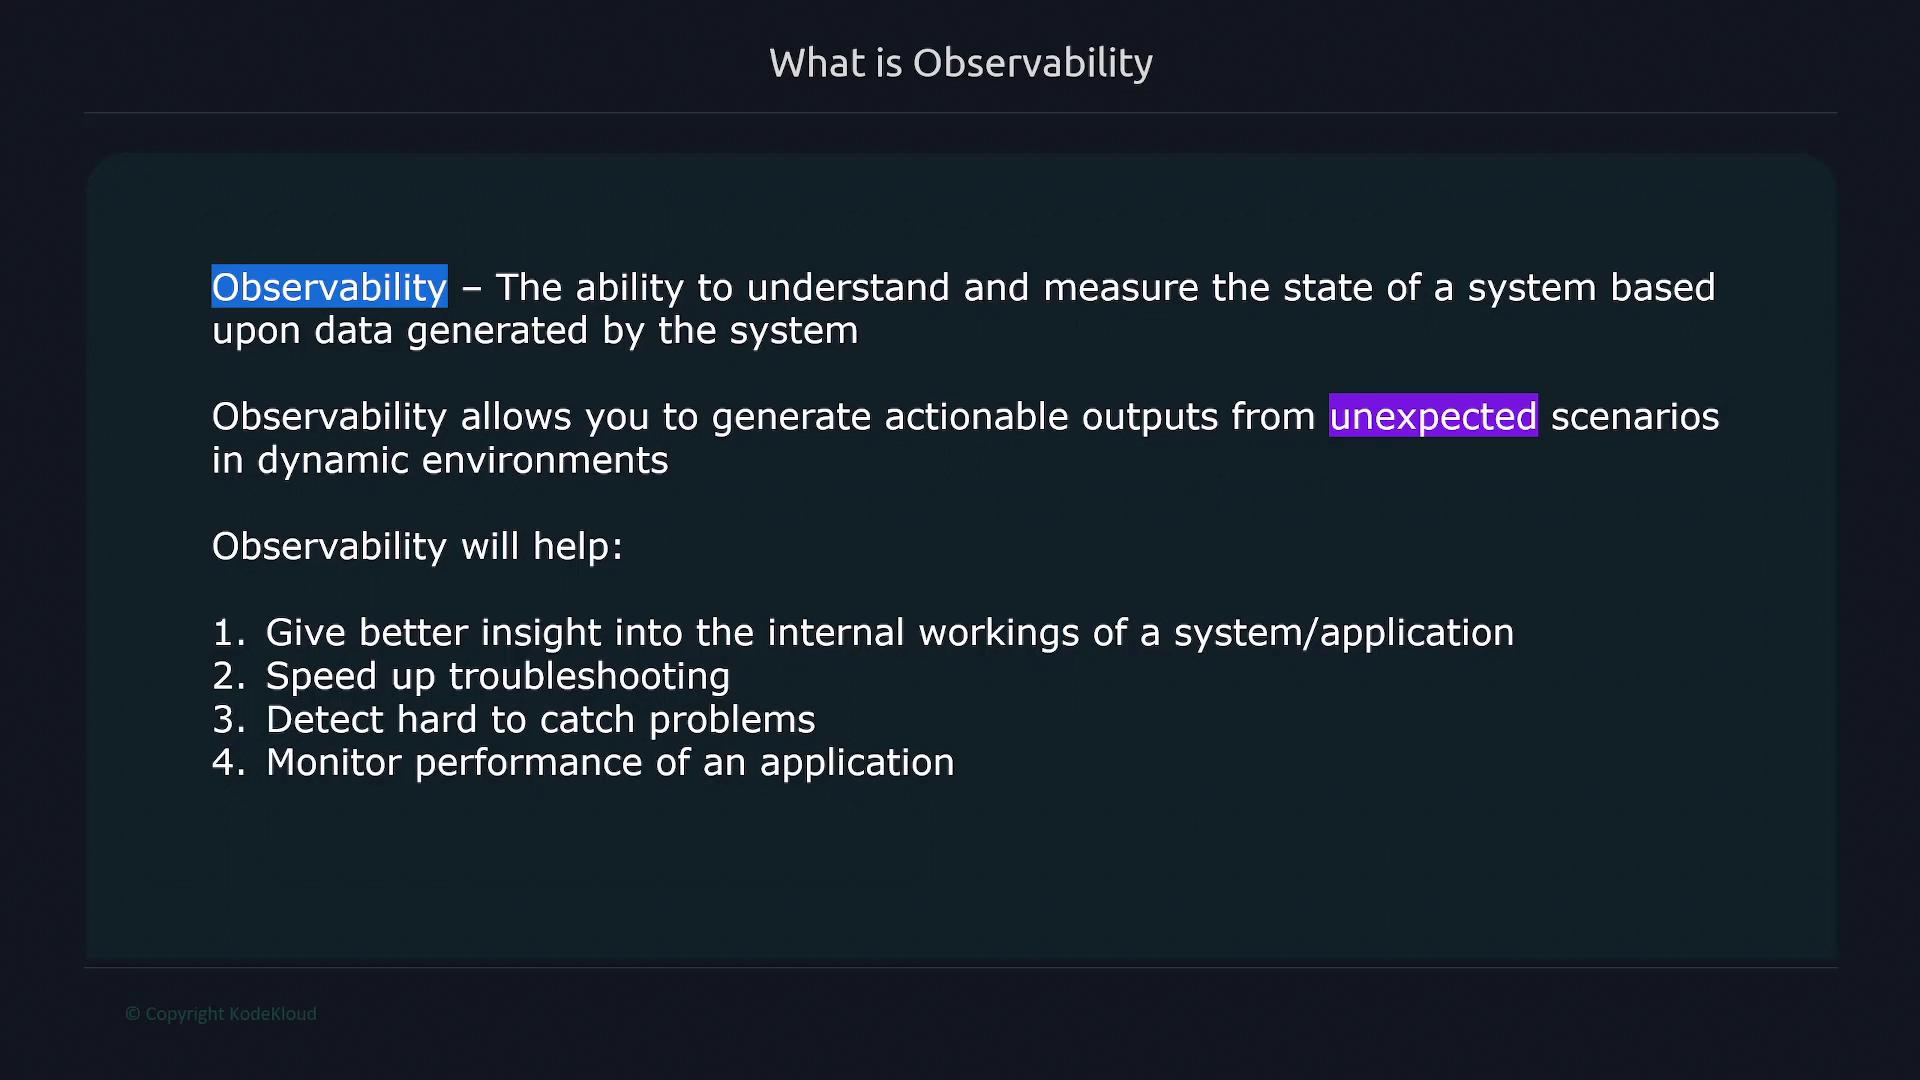
Observability is the ability to understand and measure a system's state through the data it generates. It empowers you to derive actionable insights during unexpected events in dynamic environments. Implementing observability into your application or infrastructure offers numerous benefits, including improved internal insights, faster troubleshooting, enhanced detection of hidden issues, efficient performance monitoring, and smoother cross-team collaboration. Without observability, your application behaves like a black box—accepting data and producing results without revealing the underlying processes. By "peeling back the curtains," observability shows how individual components work in unison, helping you pinpoint failures precisely when problems occur.
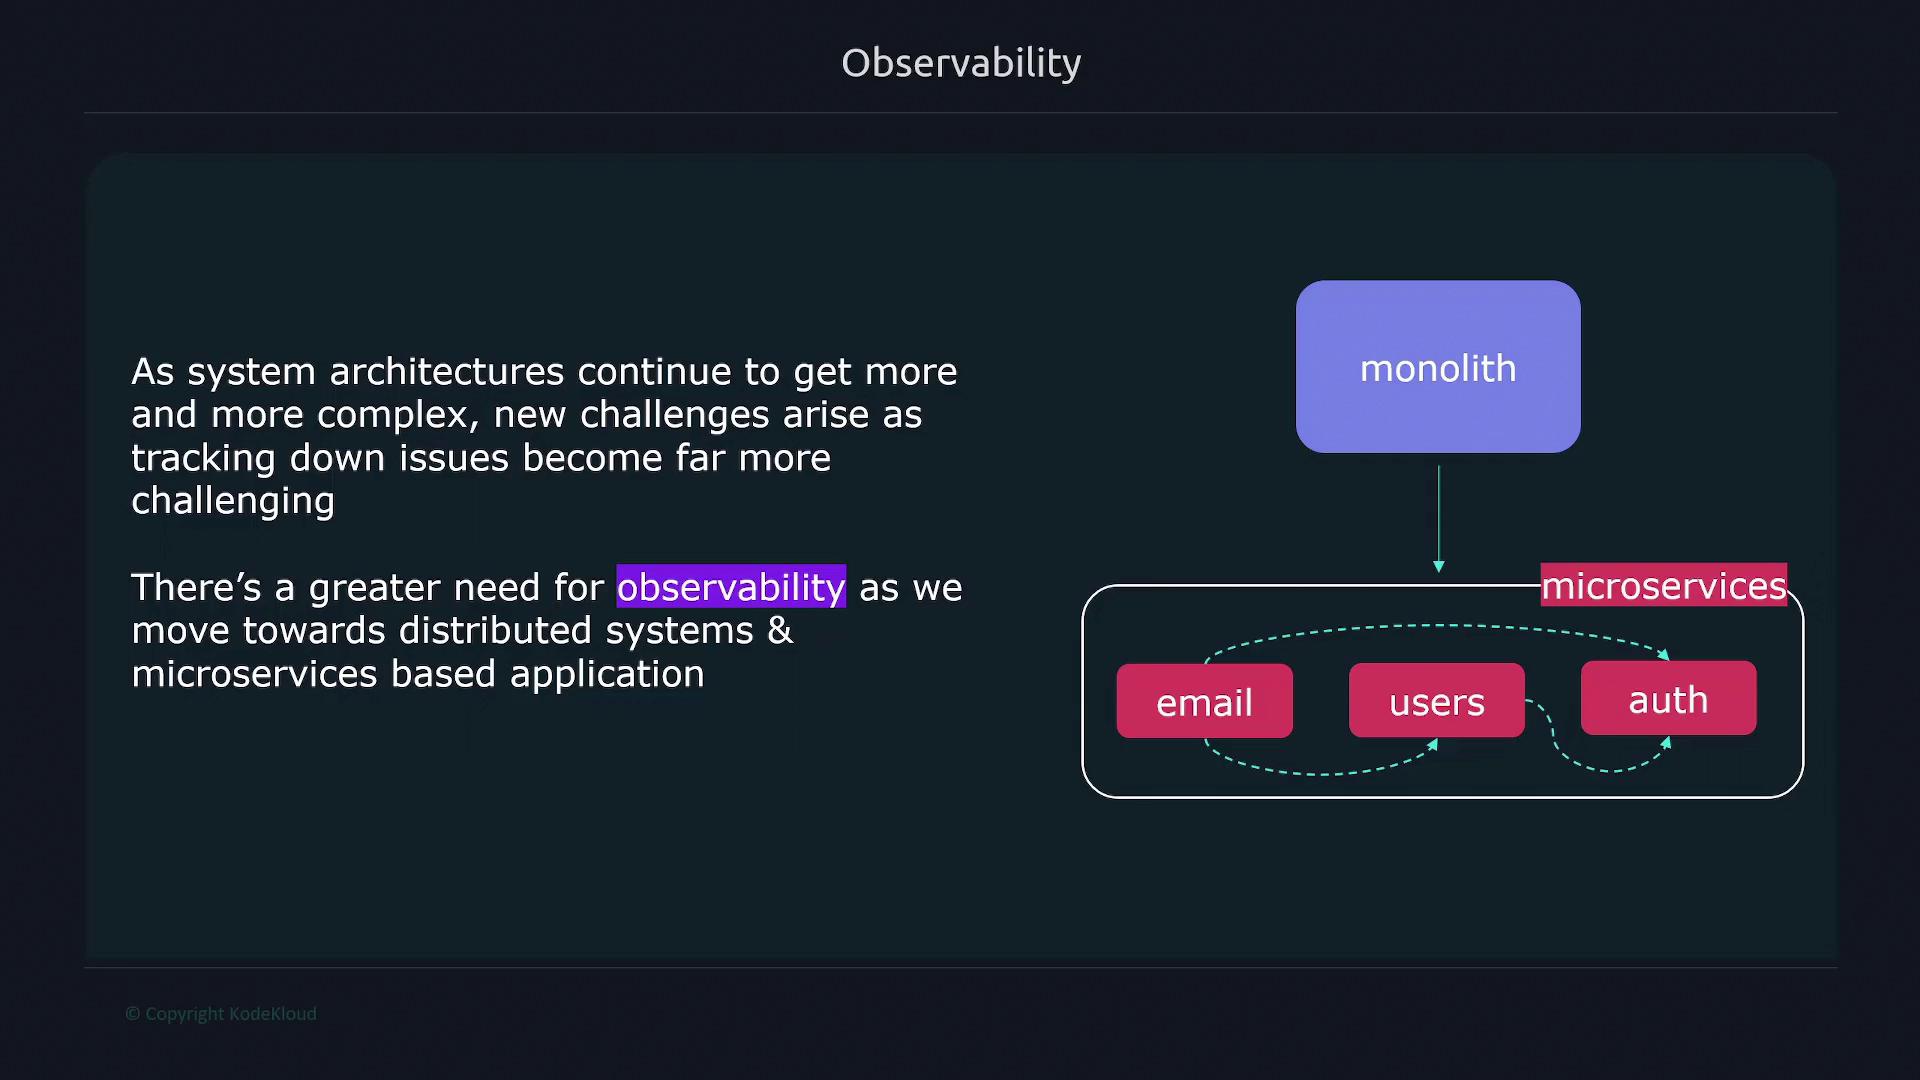
As system architectures become increasingly complex—especially with the rise of microservices—the need for effective observability grows. In a traditional monolithic application, logs and metrics are centralized. In contrast, a microservices architecture consists of multiple interconnected components, which makes troubleshooting more challenging because you must isolate the affected component, unravel the event sequence, and understand how all parts interact to cause the problem.
Insight
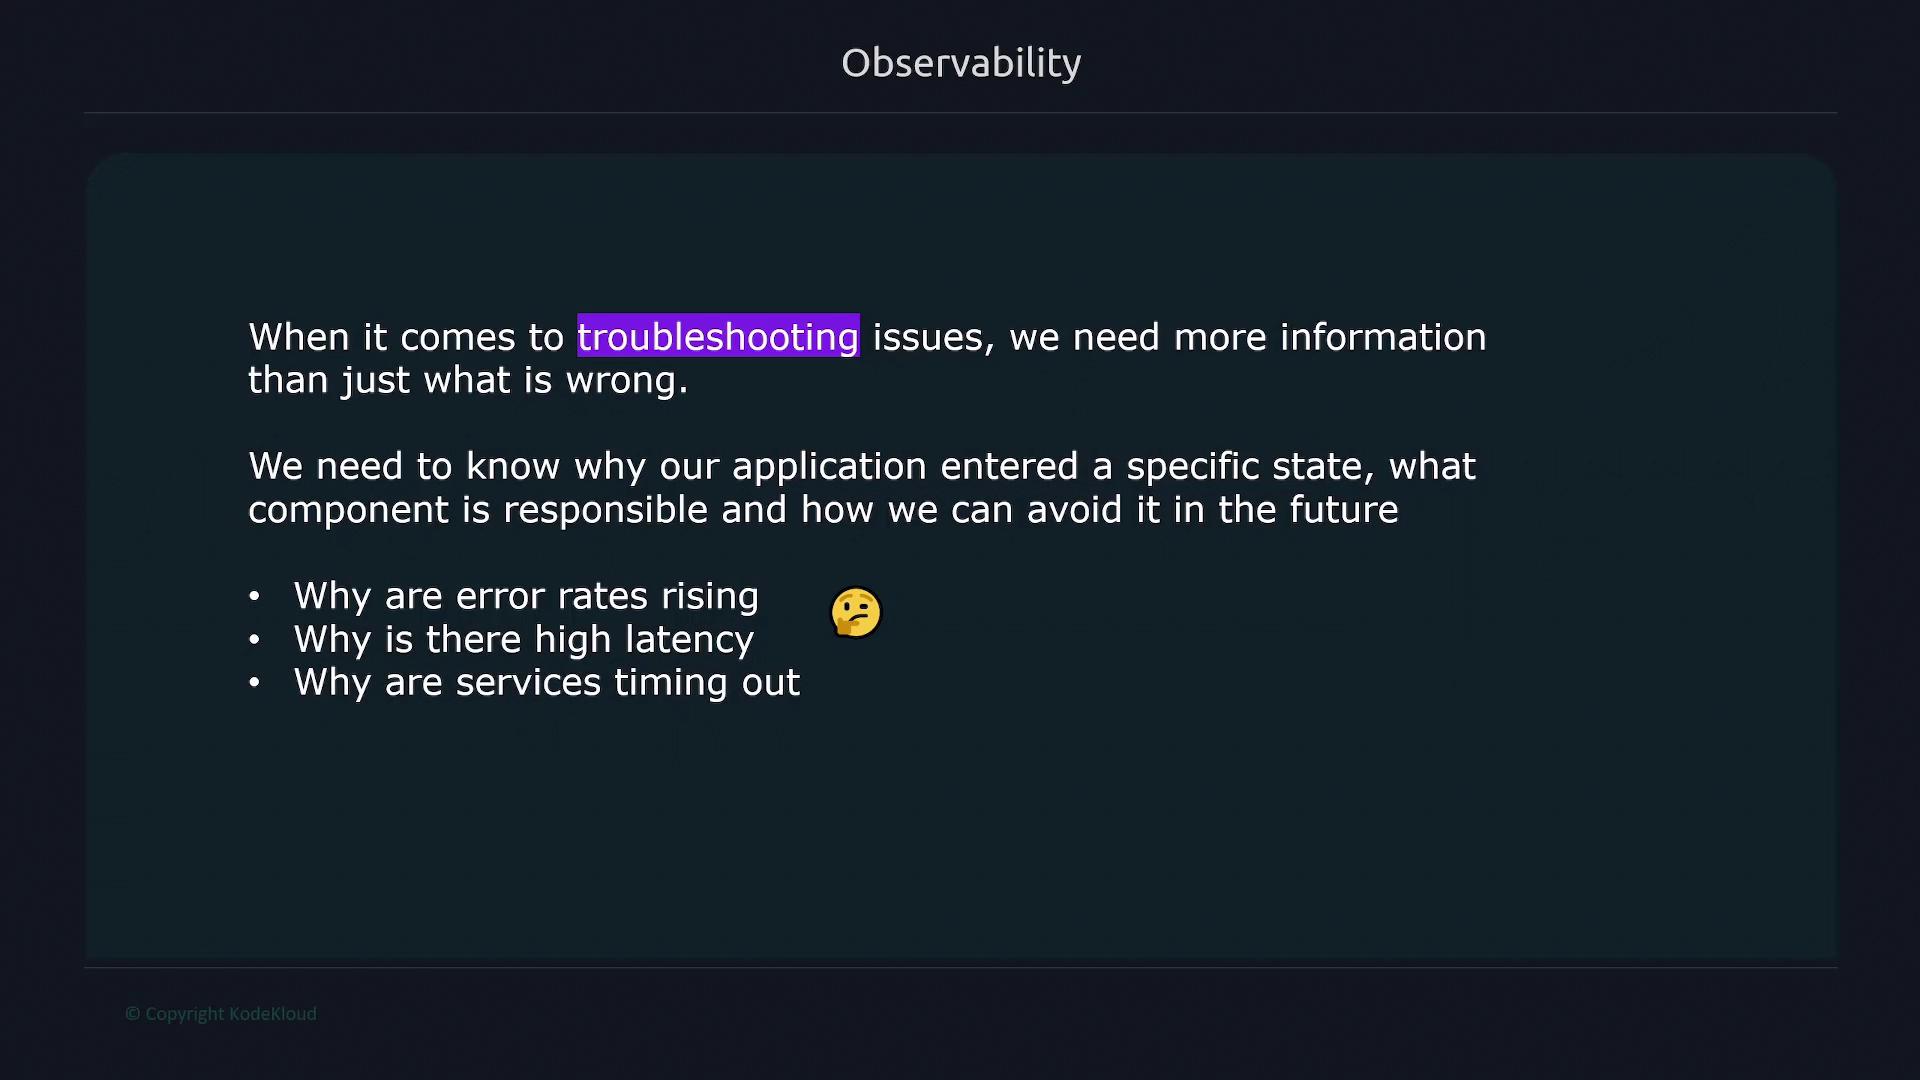
When encountering issues like increased error rates, high latency, or service timeouts, observing just the symptom isn’t enough. Effective observability helps you diagnose the underlying causes, enabling you to address both the symptoms and the root issues.
To achieve true observability, focus on three main pillars: Logging, Tracing, and Metrics.
Logging
Logs are records of events that occur within the system, capturing details such as timestamps and event messages. They are generated by operating systems, applications, databases, and more. Although logs offer a wealth of information, they can be verbose and interleaved with data from concurrent processes across various systems, making it challenging to isolate specific issues.
Below is an example of typical log entries:
Oct 26 19:35:00 ub1 kernel: [37510.942568] e1000: enp0s3 NIC Link is Down
Oct 26 19:35:00 ub1 kernel: [37510.942697] e1000 0000:00:03.0 enp0s3: Reset adapter
Oct 26 19:35:03 ub1 kernel: [37513.054072] e1000: enp0s3 NIC Link is Up 1000 Mbps Full Duplex, Flow Control: RX
Tracing
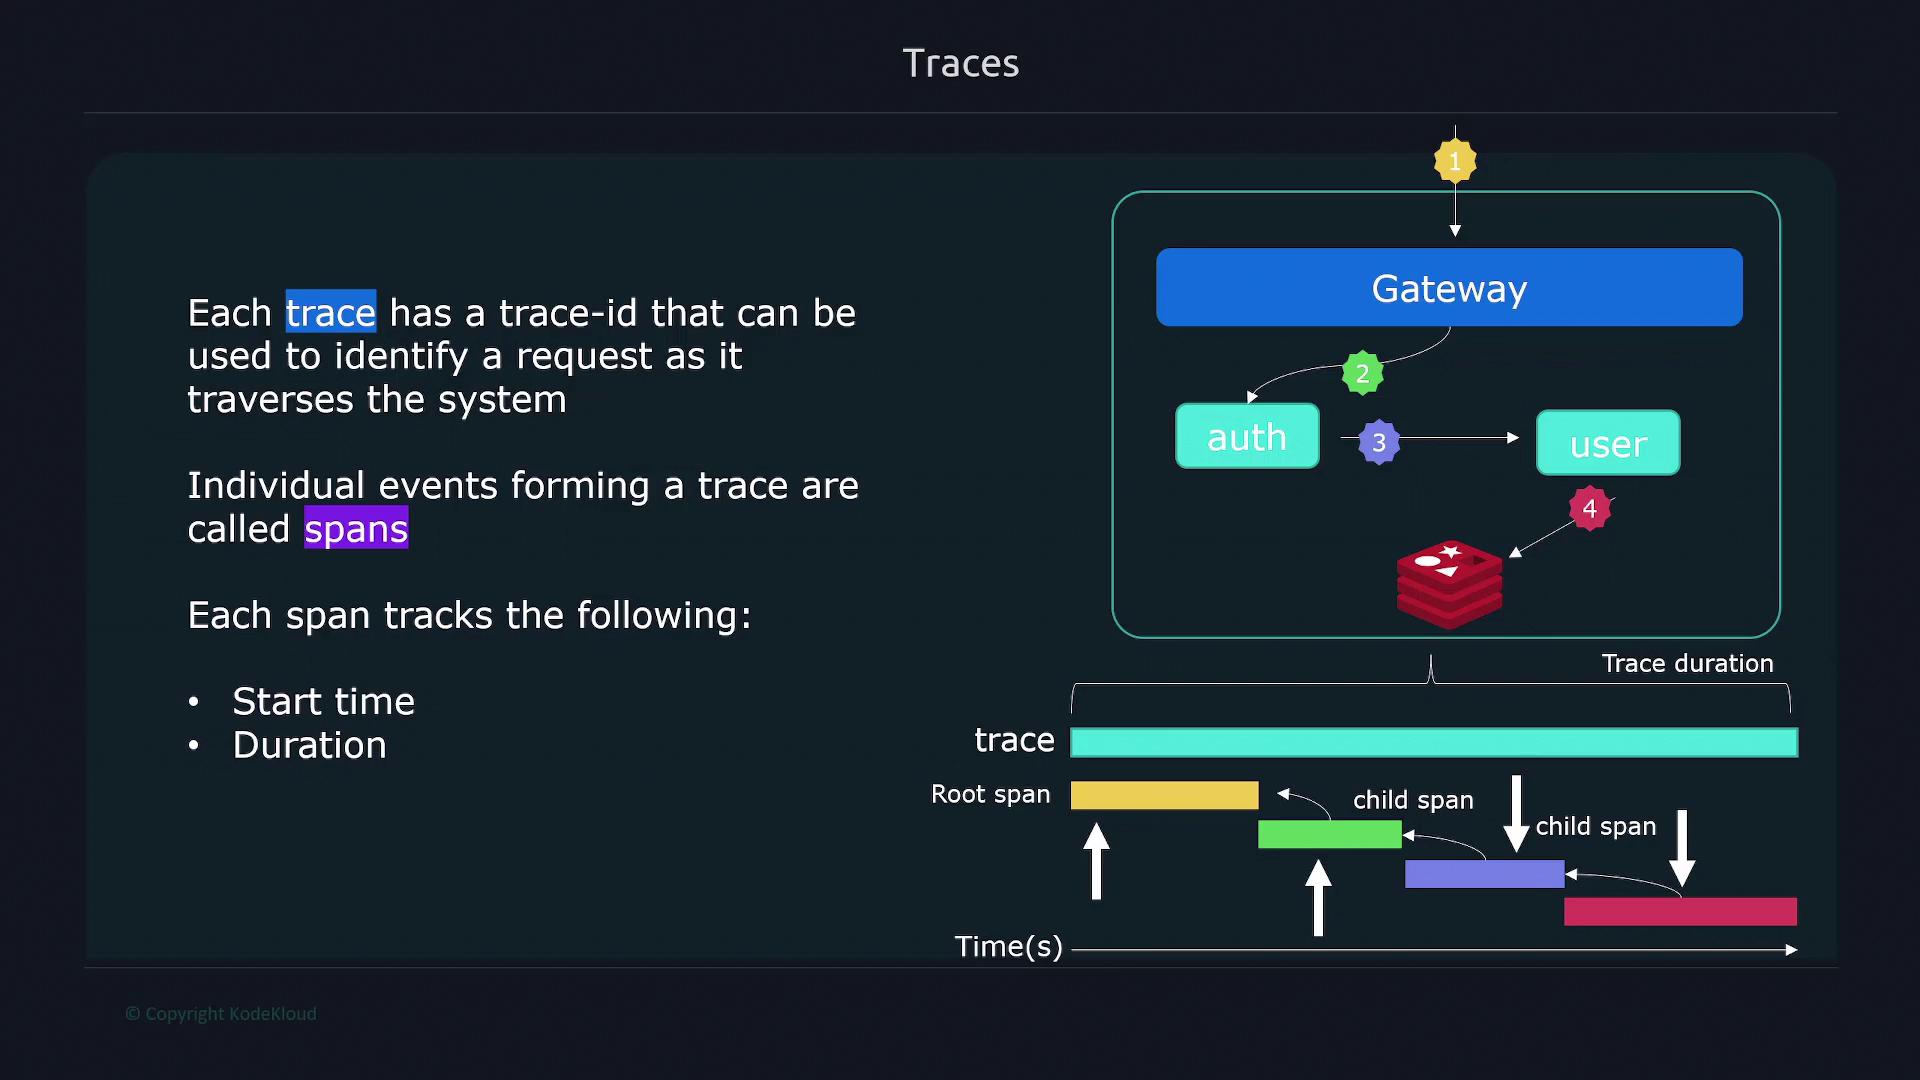
Tracing involves following the entire journey of an individual request as it traverses various systems and services. This process provides a detailed, step-by-step insight into how different components of your application interact. Each trace is identified by a unique trace ID, and individual trace events, known as spans, capture critical details such as start time, duration, and context (including parent-child relationships). These spans may be generated by components like gateways, authentication services, user management, and databases.
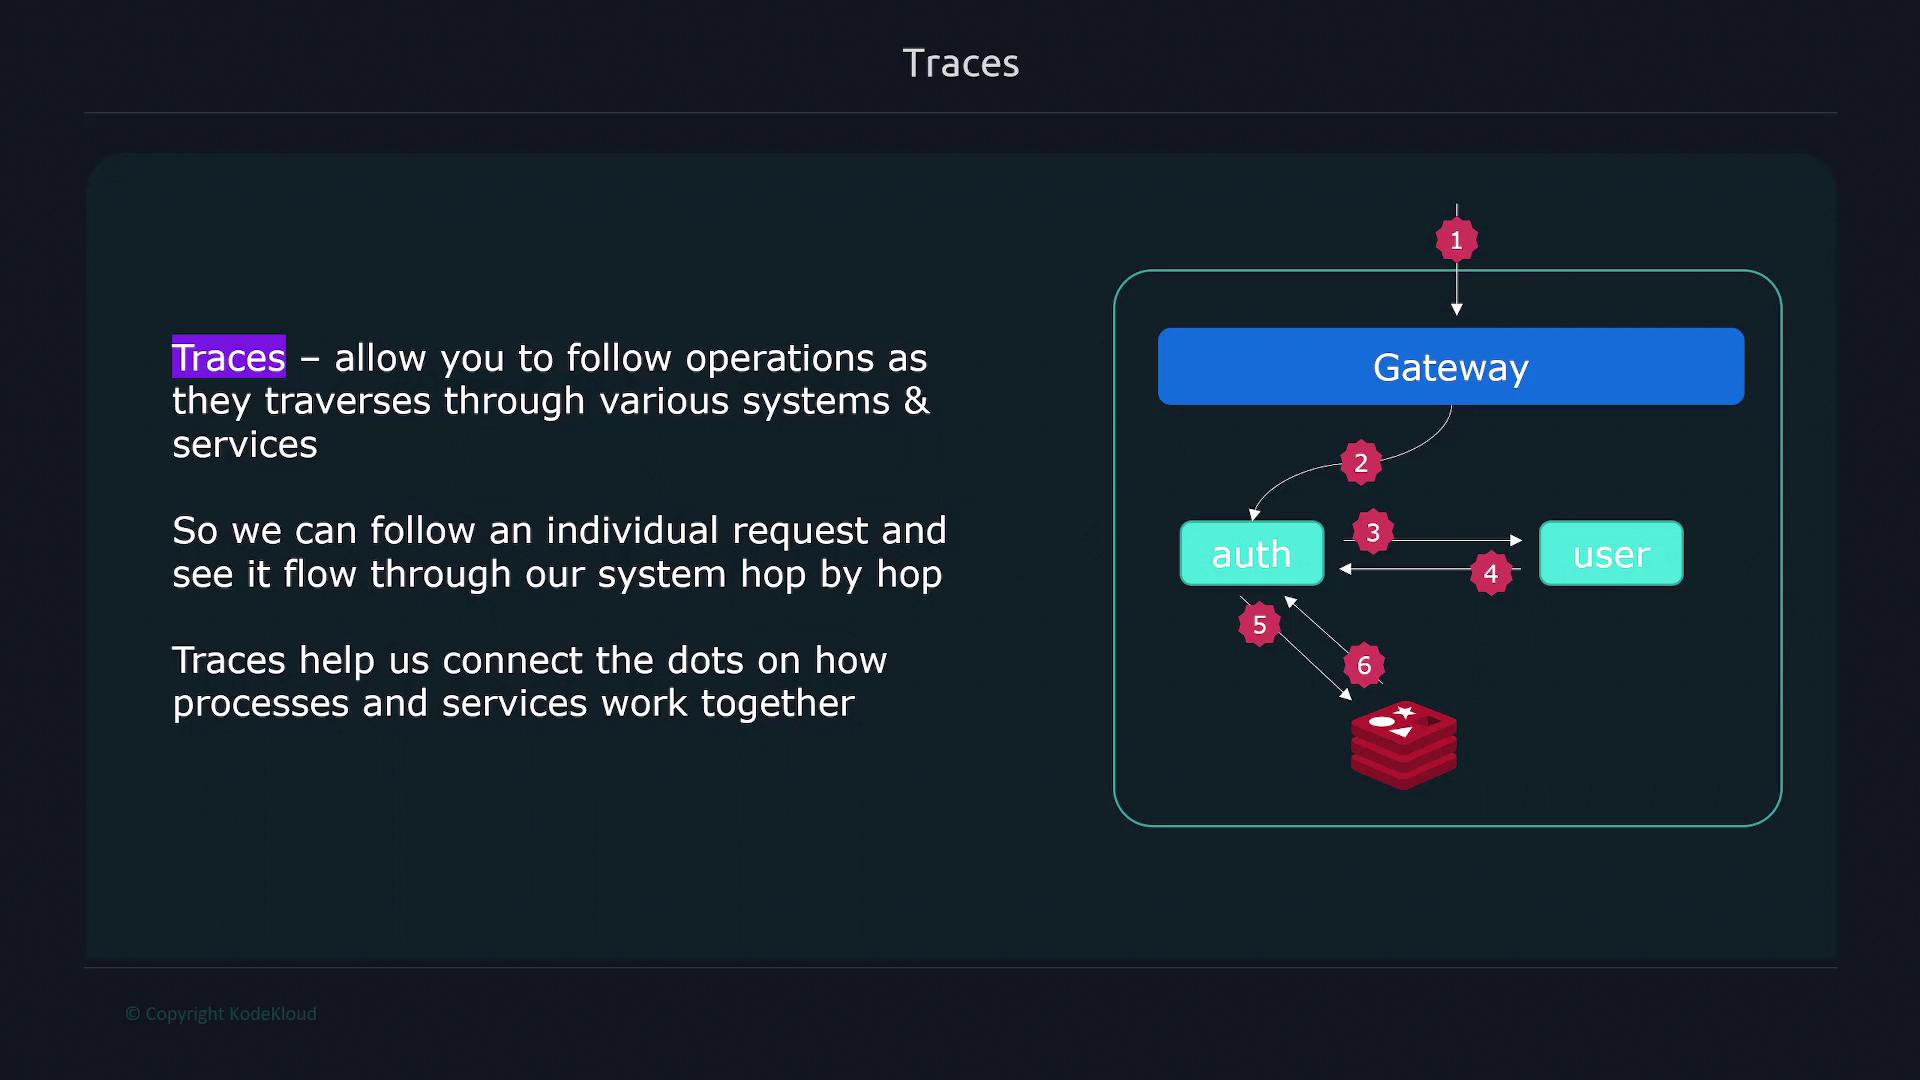
Each component in the request path produces a span. For instance, one span is generated at the gateway, another at the authentication layer, and additional spans follow as the request moves through successive services. A span records metrics such as the start time, duration, and its parent span, indicating the component that initiated it.
Metrics
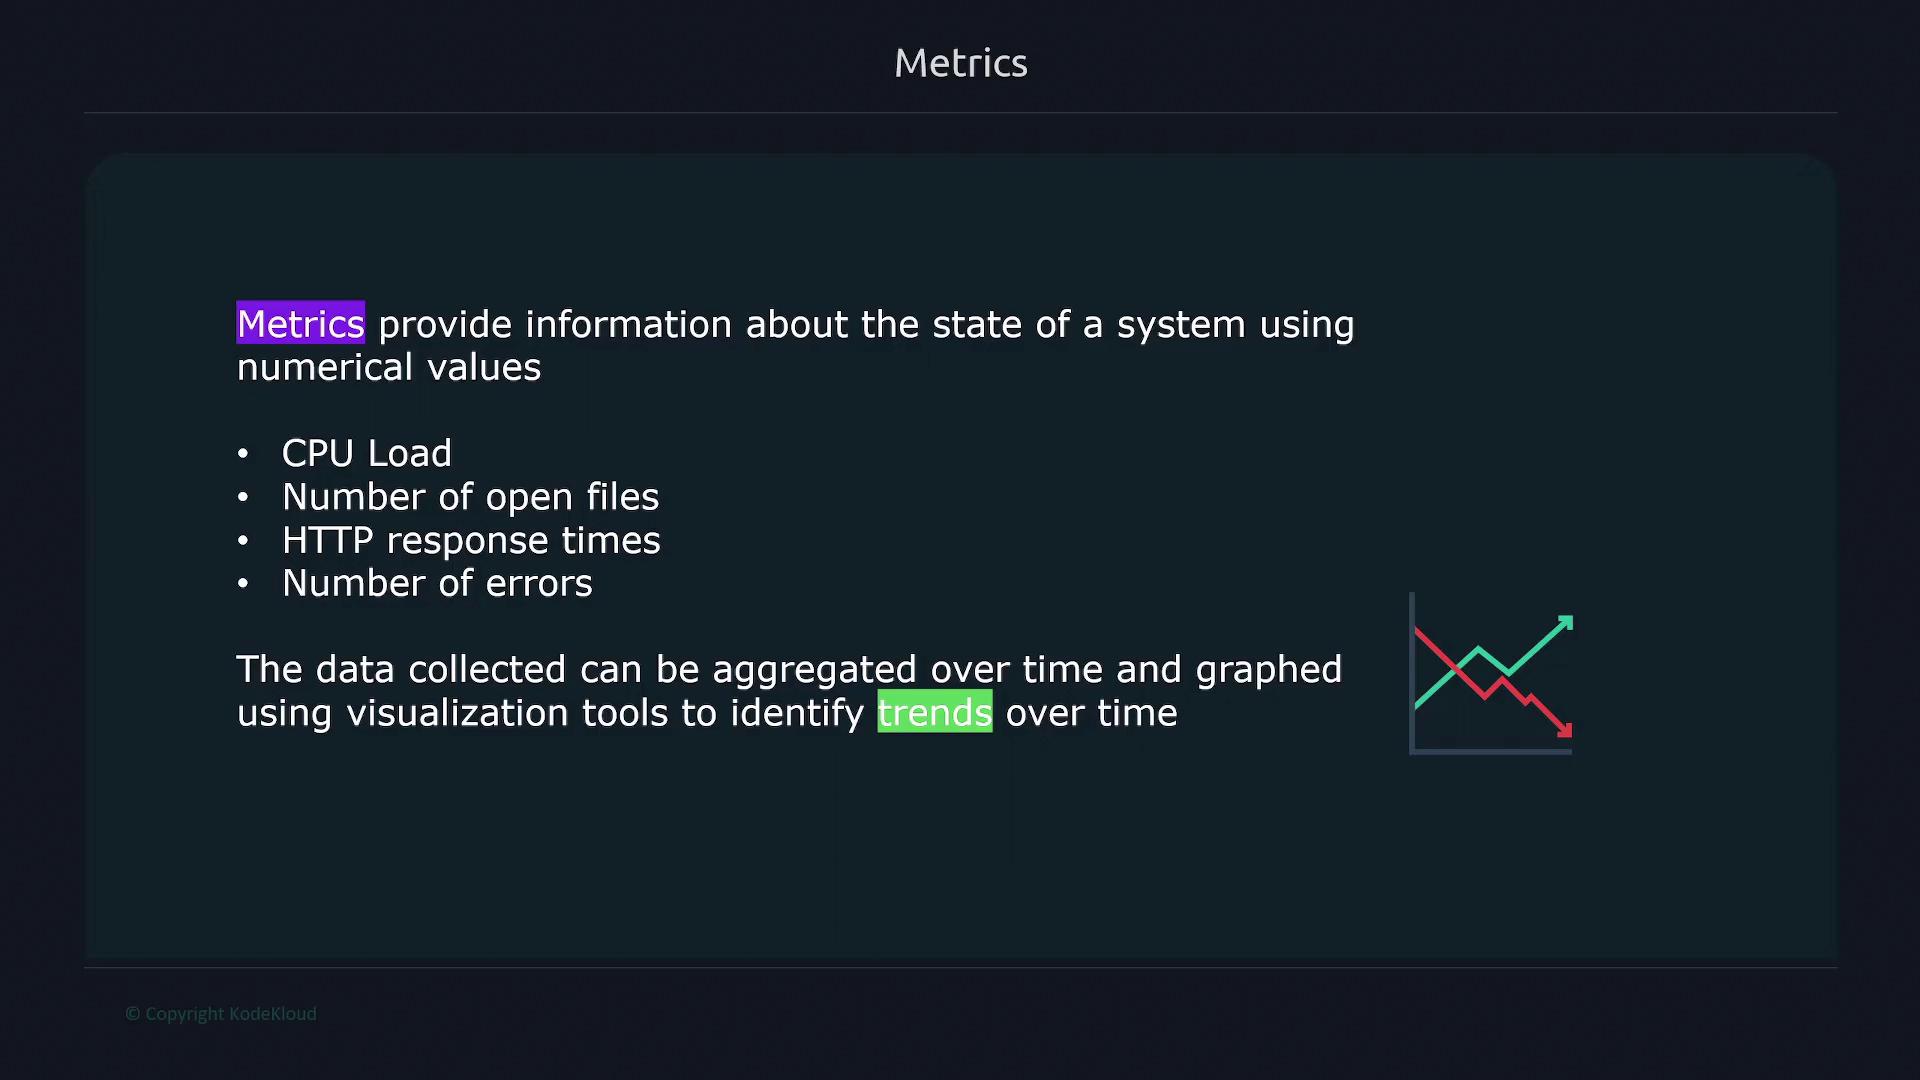
Metrics provide numerical data that reflect a system's state. Unlike logs—which are text-based—metrics track quantitative measures such as CPU load, number of open files, HTTP response times, and error counts. This data can be aggregated and visualized over time to identify trends, anomalies, and performance issues.
Metrics typically include four key attributes:
| Attribute | Description |
| Metric Name | A descriptive label explaining what the metric represents. |
| Value | The current or most recent measure of the metric. |
| Timestamp | The exact time at which the metric was recorded. |
| Dimensions | Additional tags or context that provide further insights into the metric’s meaning. |
Here’s an example of a metric recorded using PromQL:
node_filesystem_avail_bytes{fstype="vfat", mountpoint="/home"} 5000
# Collected at 4:30AM on 12/1/22
Prometheus and Its Role in Observability
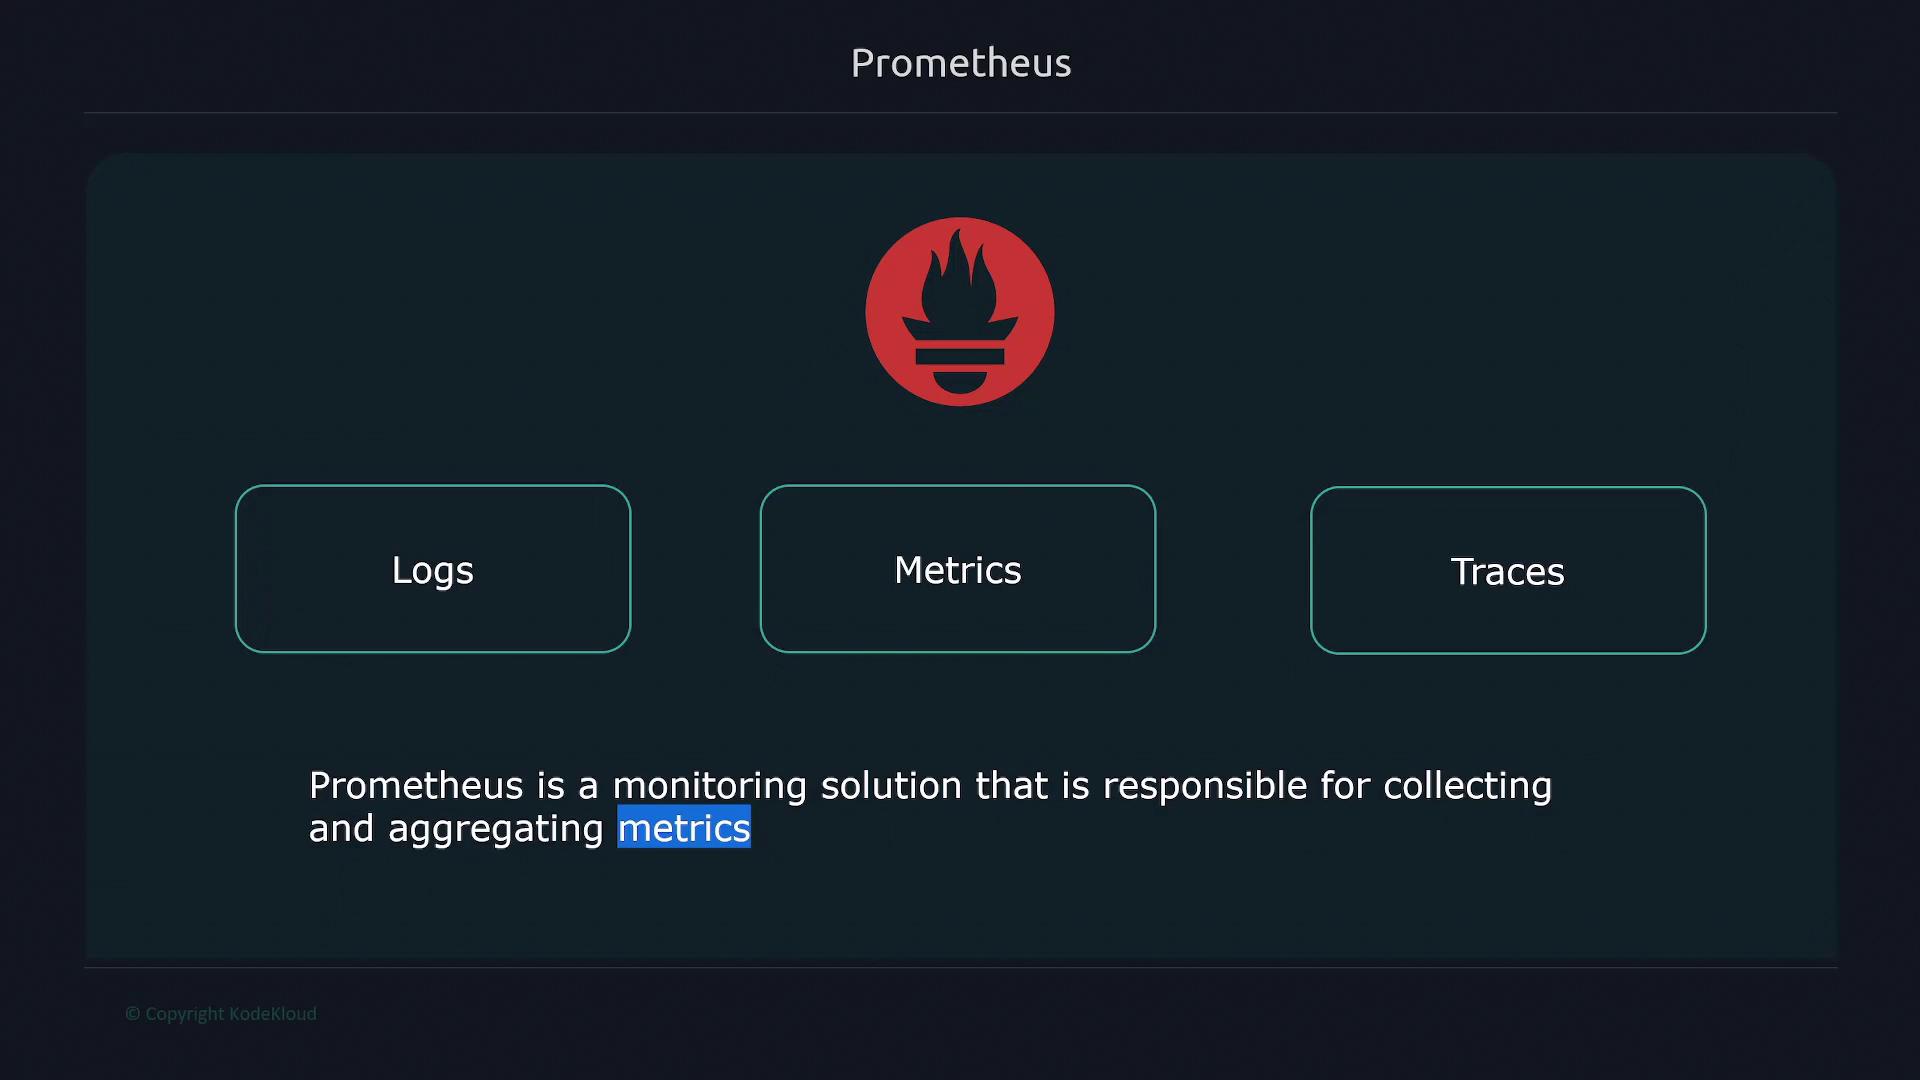
This section highlights Prometheus, a specialized monitoring solution designed for collecting and aggregating metrics data—the metrics pillar of observability. It is important to note that Prometheus does not handle logs or traces; you will need separate applications to capture those components of observability.
In summary, observability provides the means to reveal the inner workings of your system. It enables effective troubleshooting by clarifying the complex relationships between different components. As a critical part of your observability toolkit, Prometheus helps monitor and analyze the metrics that indicate your system’s overall health.
Key Takeaway
Implementing comprehensive observability practices—including logging, tracing, and metrics—is essential for managing modern, distributed systems effectively. Explore additional resources like Prometheus Documentation and Kubernetes Basics for further insights.
SLO/SLA/SLI
When designing a system or application, it is crucial to define specific, measurable targets that balance product development and operational excellence. Establishing these targets not only guides internal teams but also informs customers about the expected level of service reliability. For instance, an application might be required to maintain a 97% uptime over any rolling 30-day period.
Service Level Indicators (SLIs)
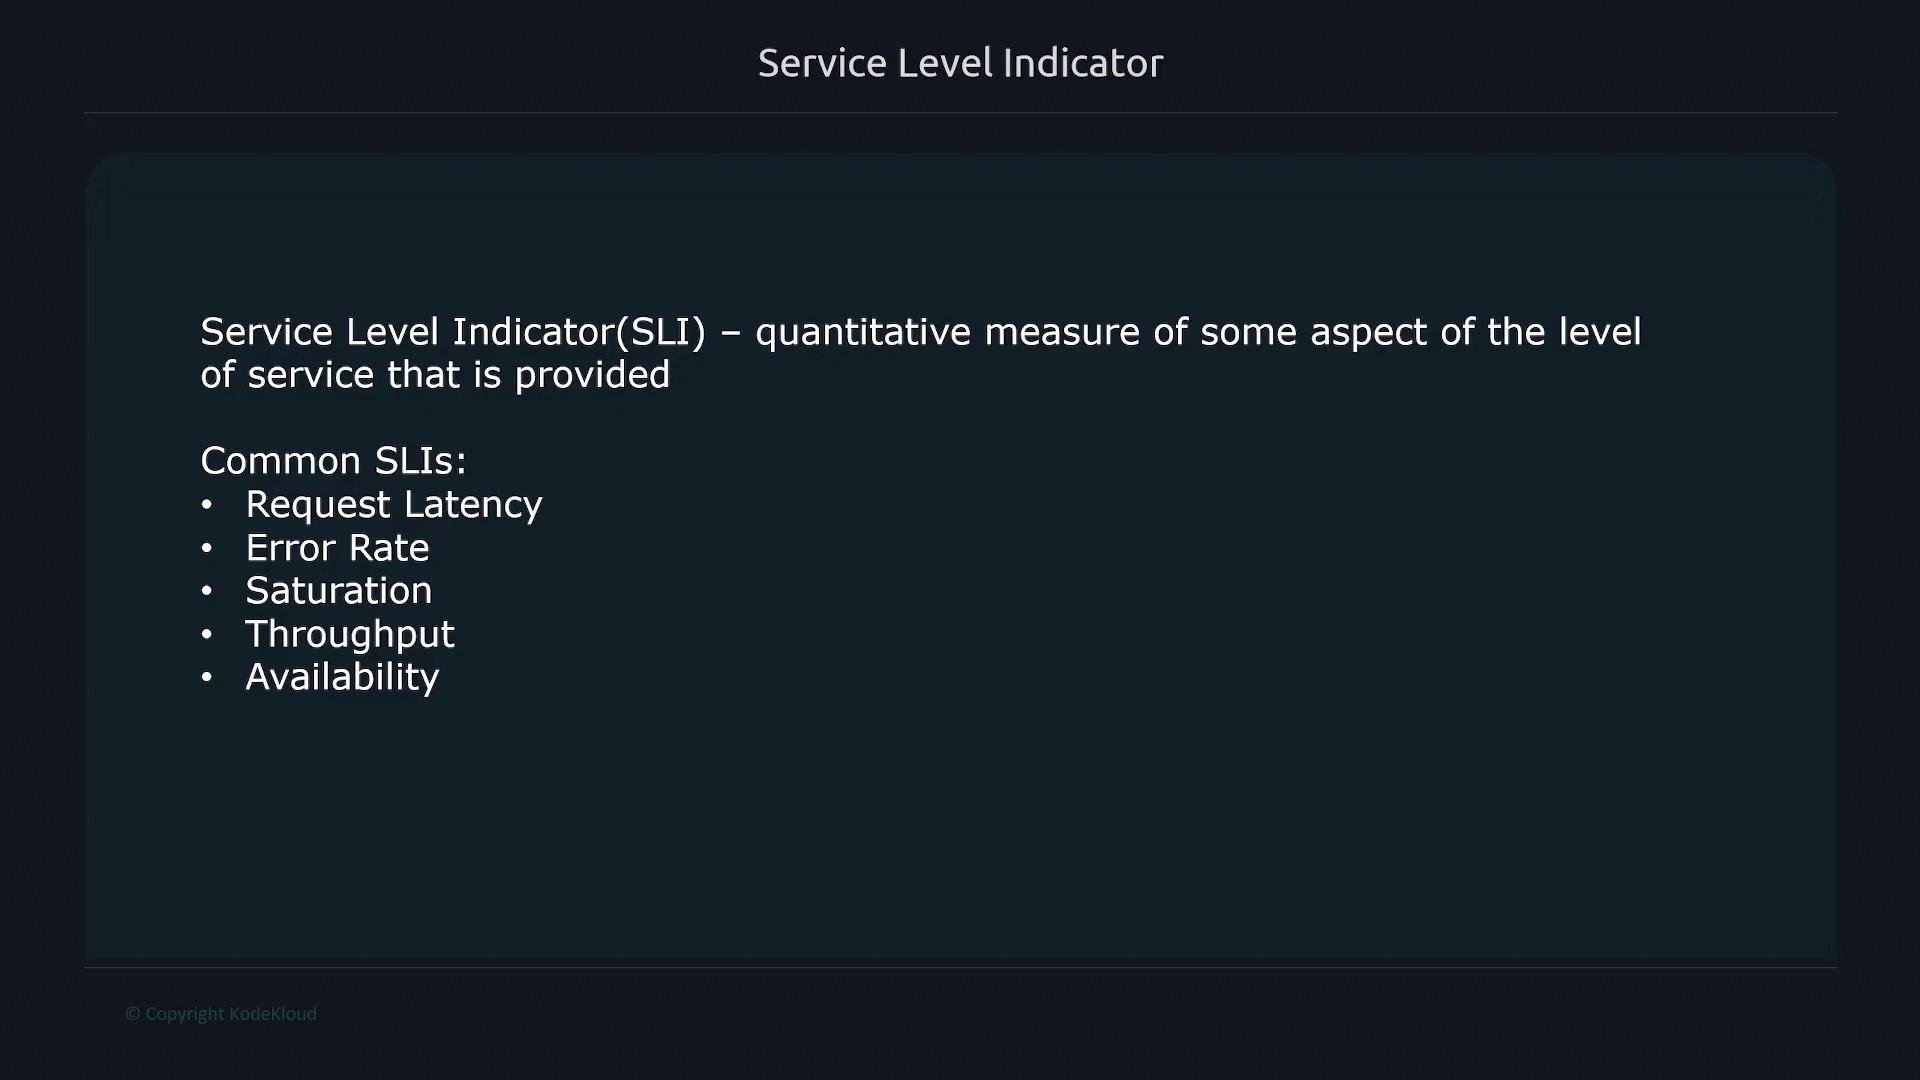
A Service Level Indicator (SLI) is a quantitative metric that evaluates a specific aspect of the service provided. Essentially, SLIs measure the quality of service from the user's perspective. Common SLIs include:
Request latency
Error rate
Saturation or throughput
Availability (uptime)
It is important to note that not every metric qualifies as a good SLI. The most effective SLIs accurately represent the user experience. For example, metrics like high CPU or memory usage are not necessarily indicative of user impact unless they directly affect performance. Instead, metrics such as response time and error occurrences are more reflective of a user’s real-world experience.
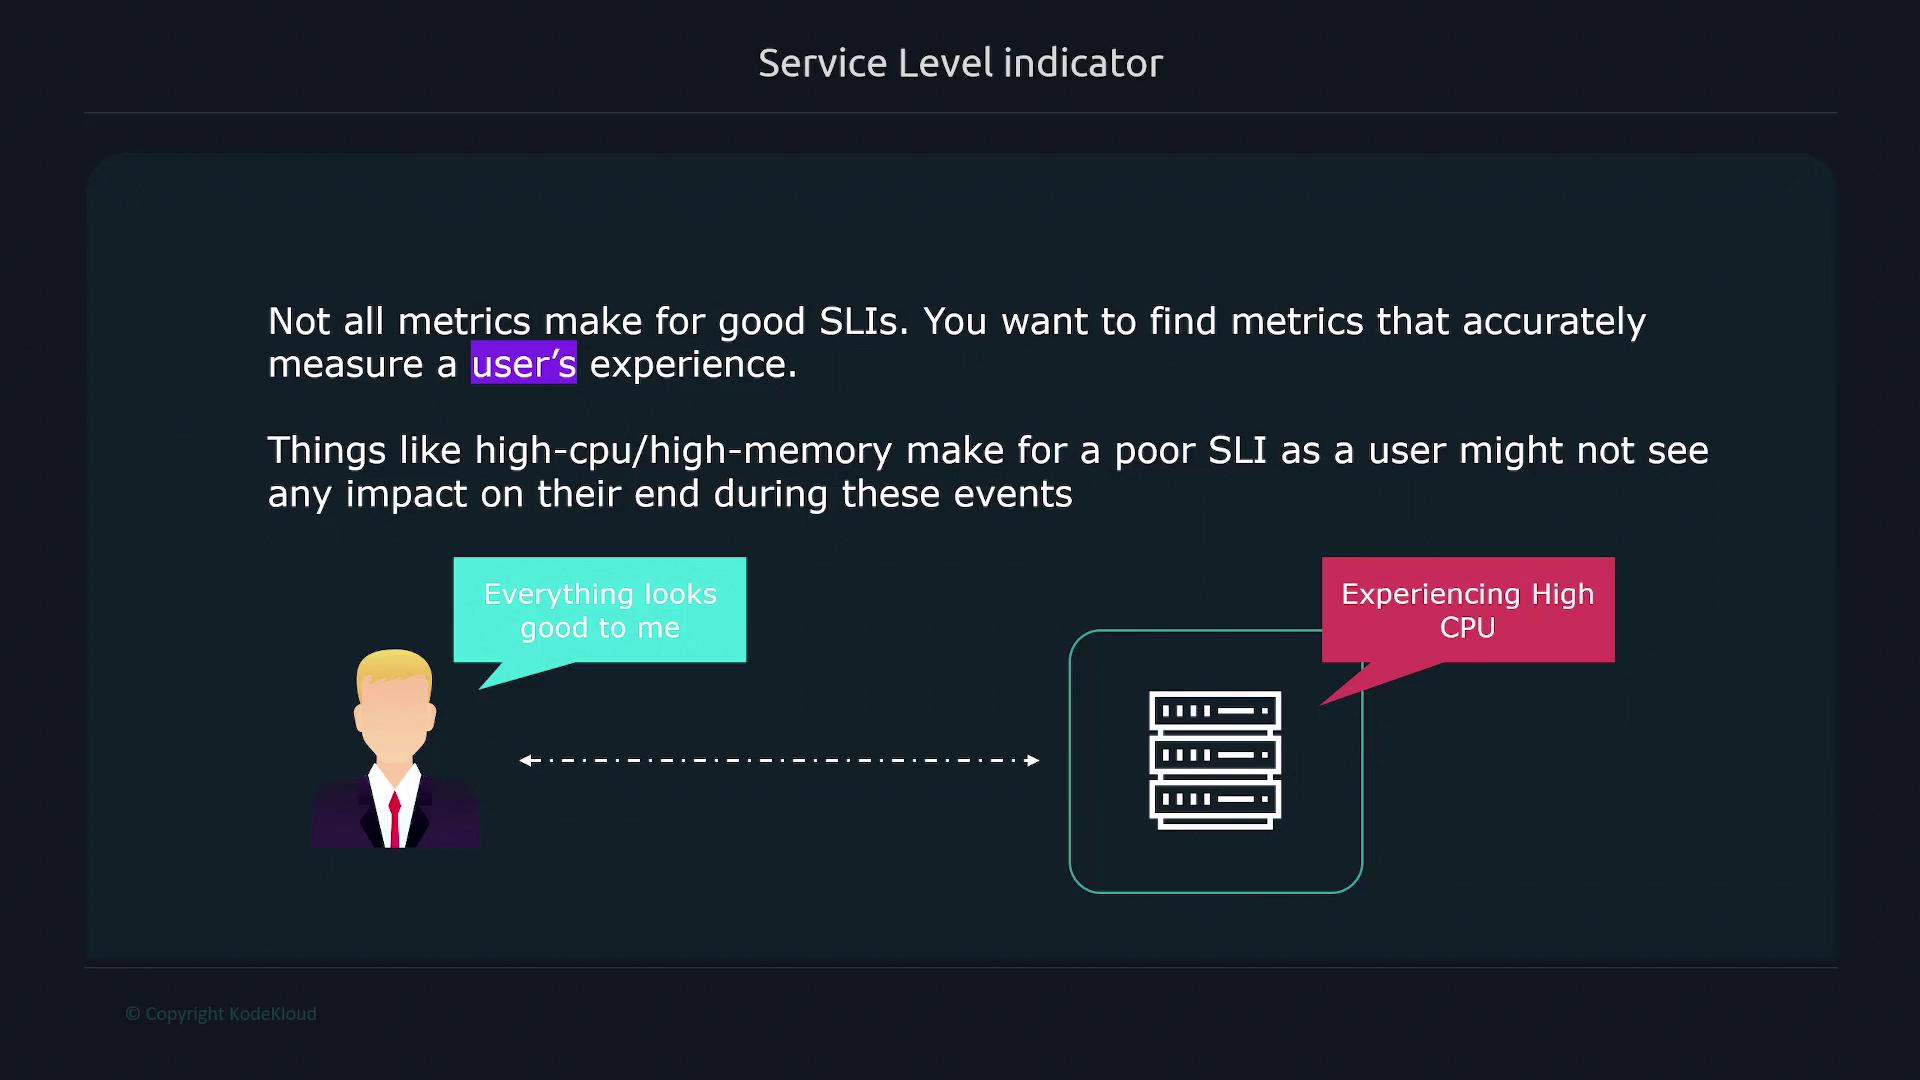
A user is immediately affected by visible errors and high response times—clear indicators that can be measured and improved upon.
Service Level Objectives (SLOs)
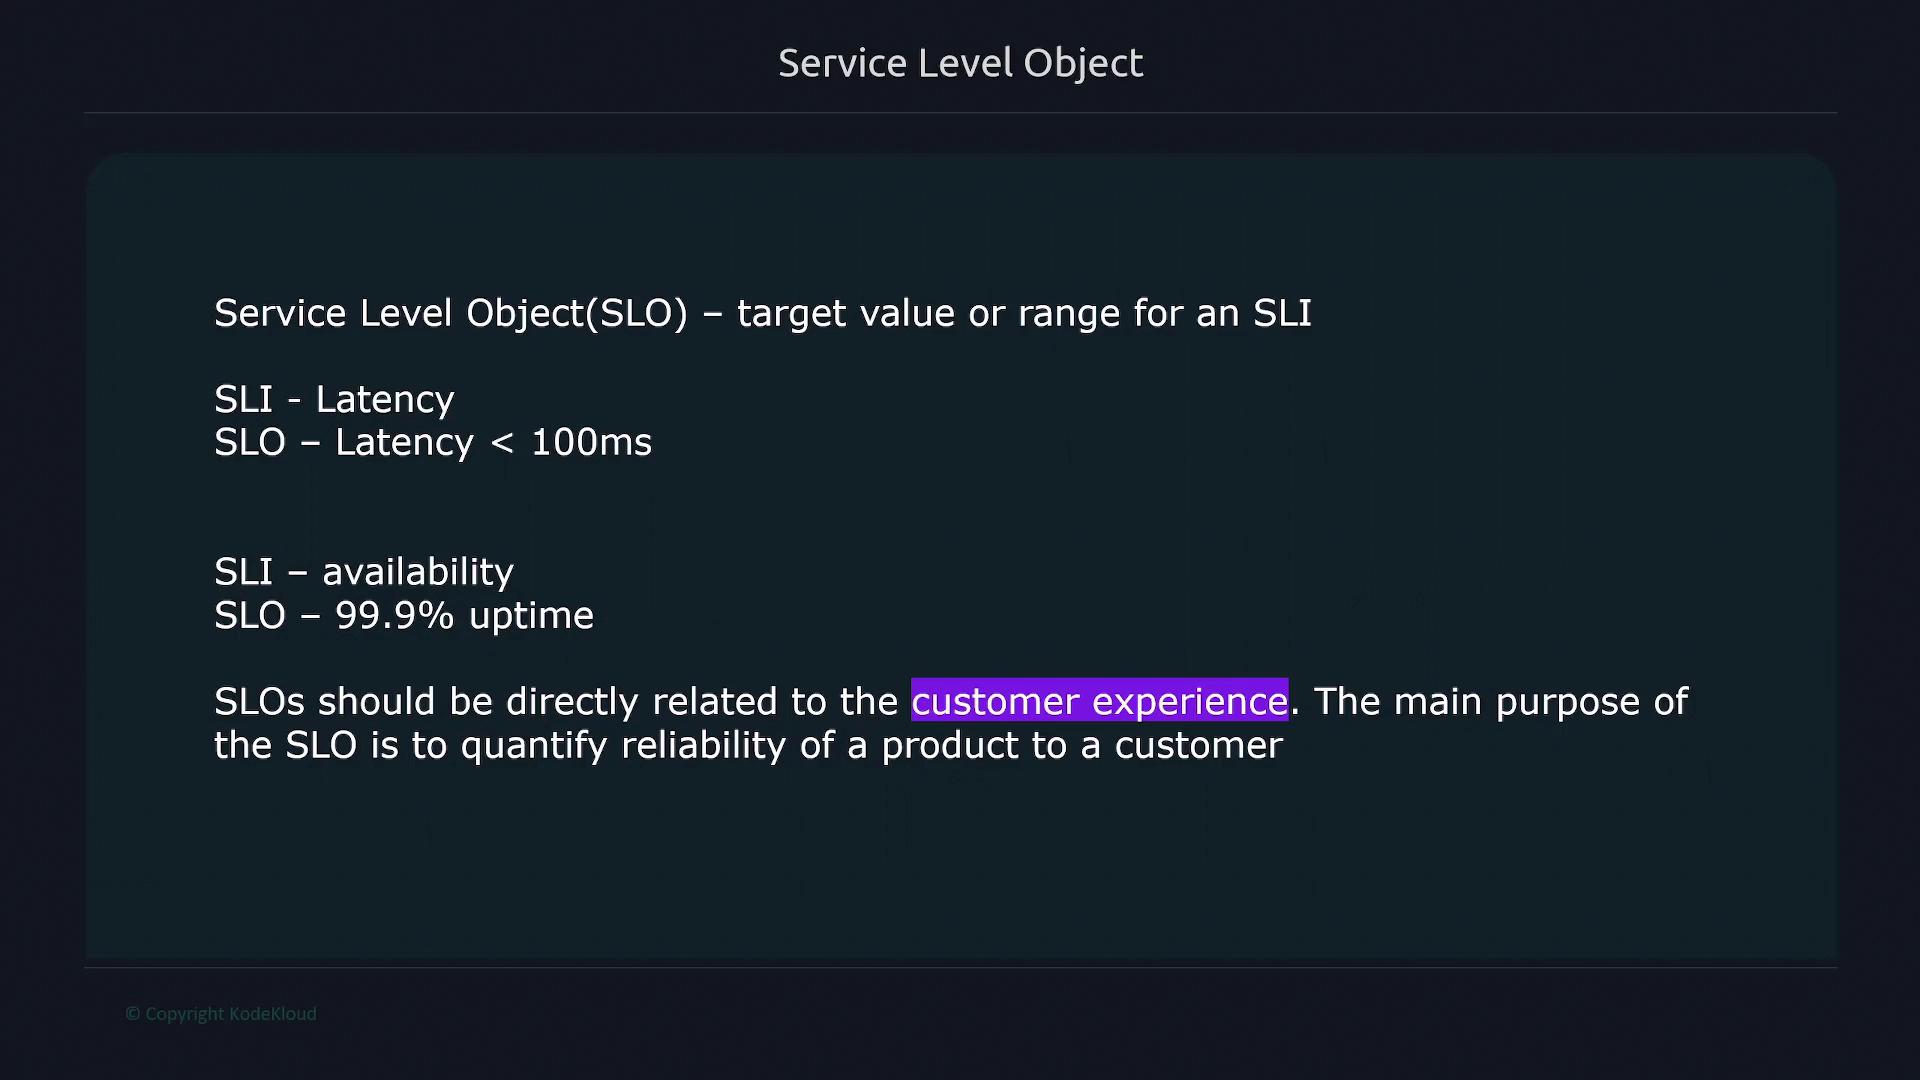
A Service Level Objective (SLO) defines the target value or range for an SLI. For example, if an SLI measures the latency of an application, the corresponding SLO might require that the latency remains below 100 milliseconds. Similarly, an SLO for availability could dictate a minimum of 99.9% uptime. SLOs are set with the customer’s experience in mind, directly quantifying the product's reliability.
Note
When setting SLOs, it is essential to choose realistic and achievable targets. Overly aggressive goals, such as 100% uptime or 99.999% uptime, can be costly and difficult to maintain.
Service Level Agreements (SLAs)
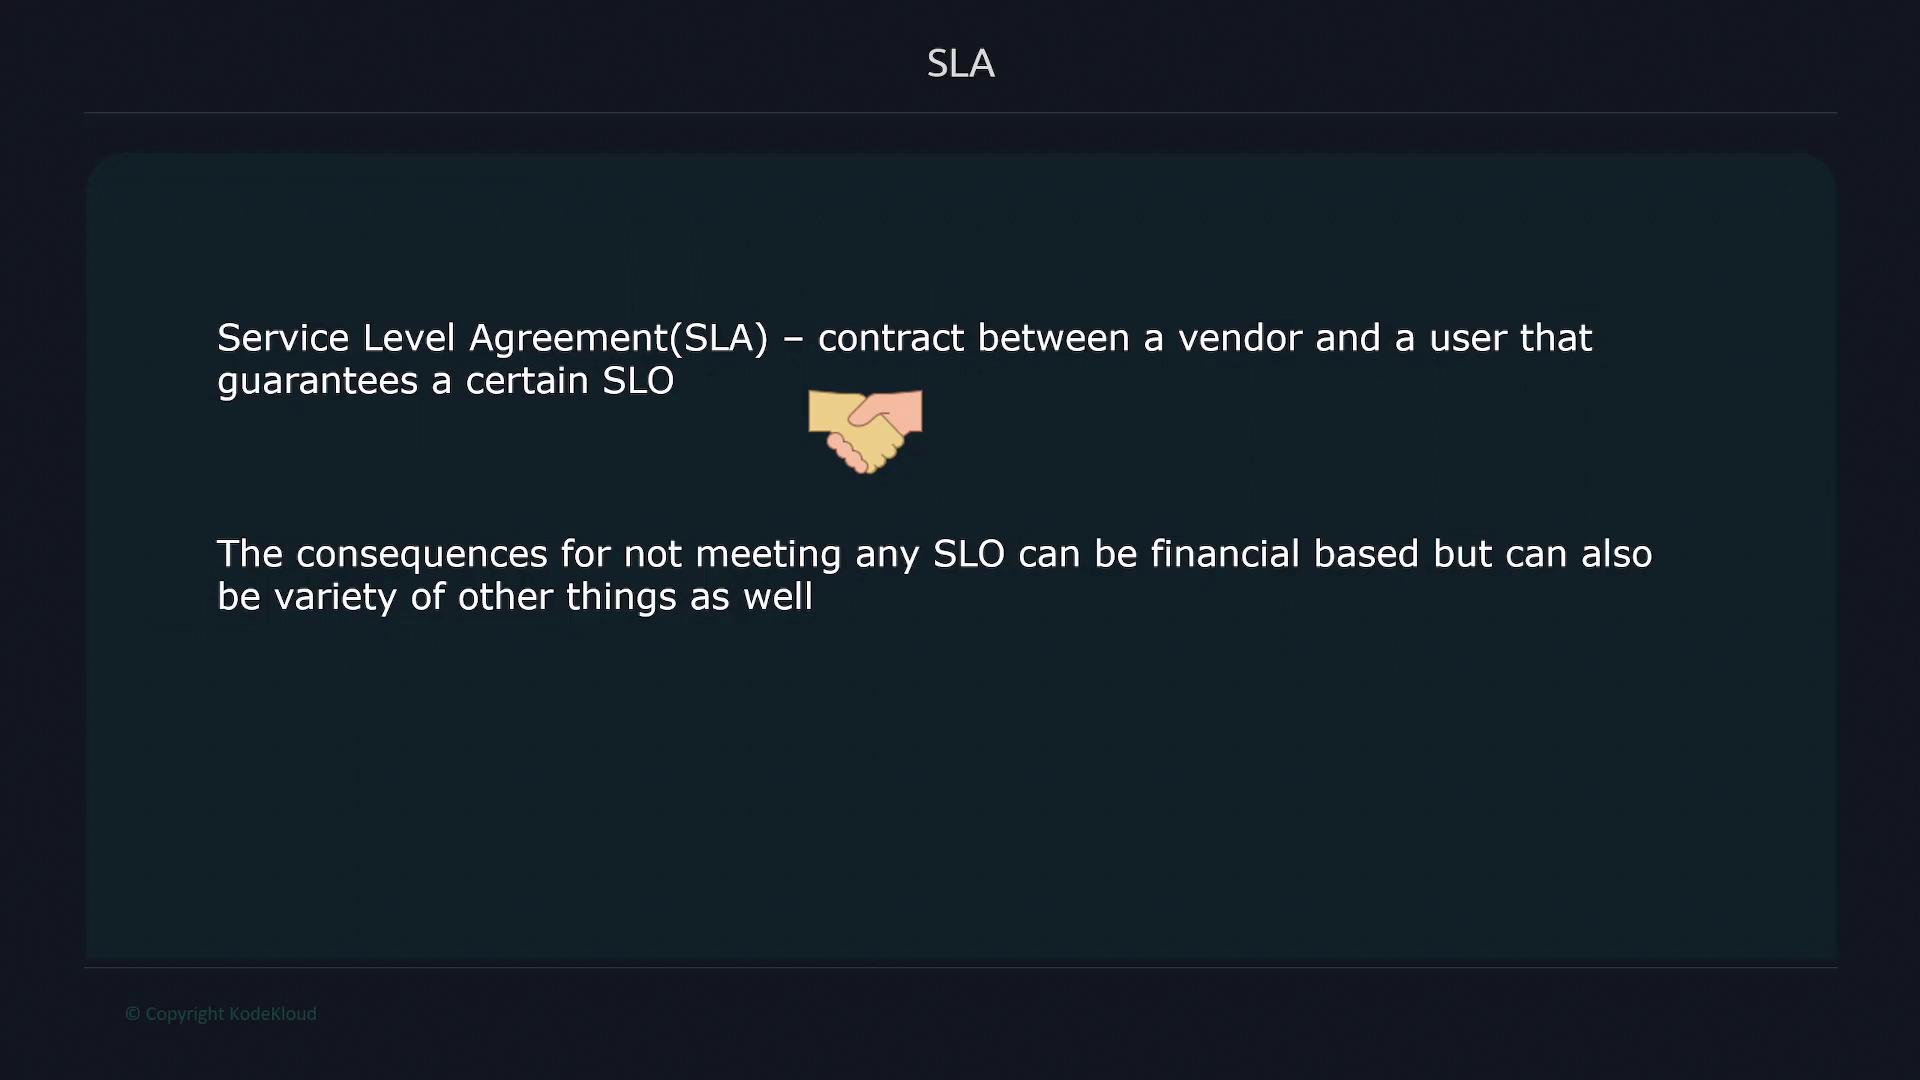
A Service Level Agreement (SLA) formalizes the targets defined by SLOs in a legally binding document. An SLA acts as a contract between a vendor and a user, guaranteeing a specific level of service quality. Should the service fail to meet the predetermined SLOs, the SLA typically outlines penalties, often in financial terms.
Summary
In summary, SLIs provide measurable insights into service quality from a user's perspective, SLOs define the desired performance targets, and SLAs formalize these expectations, ensuring accountability through contractual penalties if the targets are not met.


